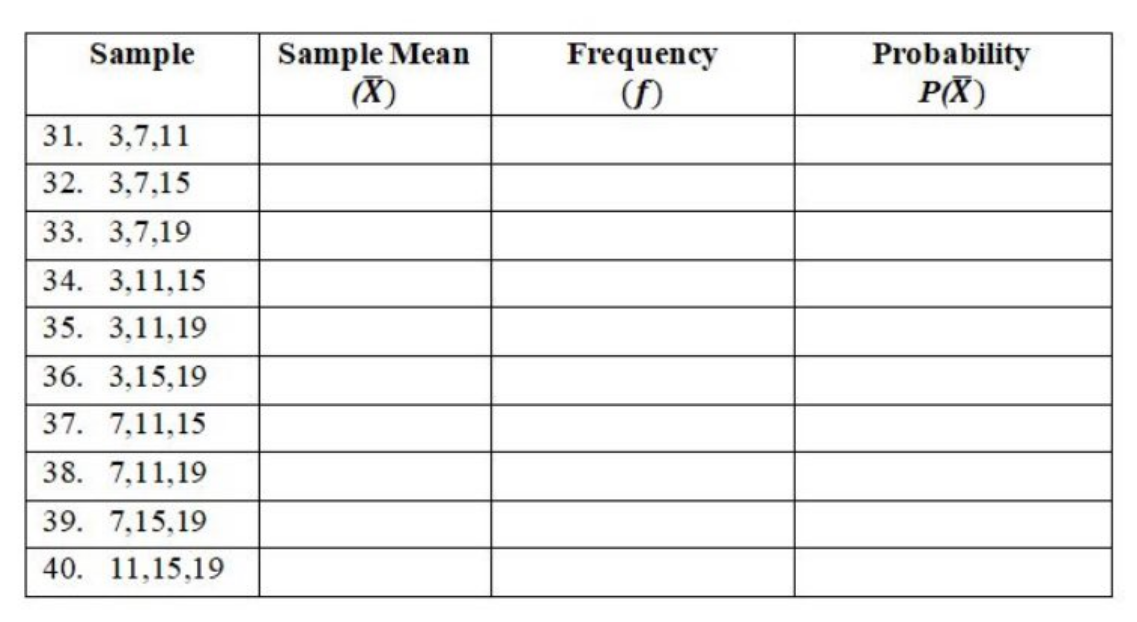
omplete the table given below


Q: We are interested in the relationship between mid-term exam scores and final exam scores. The Final…
A: For the given data given midterm = 85 then Final exam score =?
Q: Identify the type of data: Height of students in a class. Continuous Numerical Data…
A: According to the given information in this question We need to identify the type of data
Q: An epidemiologist needs to estimate the proportion of residents of Okeechobee county that have been…
A: Given that Margin of error =E =0.069 99% confidence.
Q: Ho: µ = 62.3 H1: µ < 62.3 You believe the population is normally distributed, but you do not know…
A:
Q: The caloric consumption of 41 adults was measured and found to average 2147. Assume the population…
A: Givensample size(n)=41Mean(x)=2147standard deviation(σ)=258
Q: The CEO of battery manufacturing company claims that an average battery lasts 300 days. A researcher…
A: Given n=sample size=15, sample mean x̄=290, population mean μ=300 , sample standard deviations s=50…
Q: Problem 2. Suppose that 10% of all steel shafts produced by a certain process are nonconforming but…
A: Given: n = 200 p = 0.10
Q: As the manager of a fast-food company you prefer to compare sales performance in terms of…
A:
Q: If the proportion differs from 30%, then the lab will modify a proposed enlargement of its…
A:
Q: i need help The Always Run Company advertises that its flashlight batteries last longer than…
A: There are 4 independent samples which are always run, competitor A, competitor B and competitor C.…
Q: Using Excel, conduct a t-test (at the alpha = 0.01 significance level) on whether the mean of X2 is…
A:
Q: The Damon family owns a large grape vineyard in the Niagara Peninsula. The grapevines must be…
A: Note: According to Bartleby guidelines expert solve only one question and maximum 3 subpart of the…
Q: Given that pL = 235, o = 80 , n = 64 Find 214 < X < 237 0.5614
A: Consider that the mean and standard deviation of a random variable X are µ and σ, respectively.…
Q: Researchers were interested in assessing the effects of a new treatment on seasonal affective…
A: Formula for Tukey test statistic: q=x¯i-x¯jSEANOVA From the given information, Excel Procedure:…
Q: 6. 6 y -8 7 If a linear regression were fit to the data, how many residuals would there be? 6. 4…
A: We have given that the data of two random variables X and Y.
Q: 4. Calculate the variance of the set of data to two decimal places. Refer to the previous problems.…
A:
Q: A distribution of values is normal with a mean of 60 and a standard deviation of 3. Find the…
A: Given that X~Normal(μ=60 , σ=3)
Q: A large discount department store chain advertises on television (X1), and on the radio (X2). A…
A: Note: Hi there! Thank you for posting the question. As you have posted multiple questions, as per…
Q: 4. What is the mean height of the given set of data? (Show your solution)
A: The heights of all fourth grade students in a particular school, and the frequencyof each height is…
Q: Refer to the accompanying table, which describes the number of adults in groups of five who reported…
A: Given that ; X represents the number of adults in groups of five who reported sleepwalking P(x) is…
Q: following equations in R3. (a) x2 + 2y2 + z2 − 8x + 12y − 2z + 35 = 0 (b) z = 1 − ex (c) x2/9 −…
A: *Answer:
Q: From past records, a department store finds that 70% of the people who enter the store will make a…
A:
Q: Theorem:- af, X2, 13, Xy , Ng be The Yandom sample of size 5 from normal papulation. t, to = 2 t3 =…
A:
Q: tics (BLS) administer the American Time Use Survey (ATUS). Researchers estimate the average amount…
A:
Q: Use the given shaded area (0.8311) in the middle of the standard normal distribution and the given…
A:
Q: Tukeys Groups MK 15.67 6.33 Primary school Junior high school 11.75 6.92 High school 4 17.25 4.92
A: Whole calculations is in the image uploaded below
Q: Calculate the numerator for the F statistic (between group variance) b) Calculate the denominator…
A: From the given information, the data is displayed below. Here, n1 =3, n2=4 and n3=4 The total…
Q: If you are given n=593n=593 and p=0.3p=0.3 for a binomial experiment, use the normal distribution to…
A: Given information: n=593 p=0.3
Q: 5. A radar unit is used to measure speeds of cars on a motorway. The speeds are rounded off to the…
A:
Q: Find the z-score for the given shaded region under the standard normal distribution. Round yo answer…
A: The shaded area is 0.47.
Q: A confidence interval for the average y-value at x = 6 from a simple regression was calculated to be…
A:
Q: 8. If 1500 students took the test, how many will NOT be awarded?
A: 8. From the given information, the probability for awarded is 30% P(awarded)=30%=0.30 P(not…
Q: INTERPRETING STATISTICAL TESTS 1. Below are the results of at-test comparing the (totally made up)…
A: Since you have posted multiple question, we will solve very first question for you. To get remaining…
Q: Assume that the average weight of an NFL player is 245.7 lbs with a standard deviation of 34.5 lbs.…
A: Let X be the random variable from Normal distribution with mean (μ) = 245.7, standard deviation (σ)…
Q: At a=0.05, what is the critical value? -1.984 1.66 -1.645 -1.66
A:
Q: 1. Find the least square line for the data (а) (b) Xk Yk f(xx)
A: a) xk yk xk^2 yk^2 Xk*Yk -2 1 4 1 -2 -1 2 1 4 -2 0 3 0 9 0 1 3 1 9 3 2 4 4 16 8…
Q: A forester with the National Park Service was tasked with estimating the average age of the bald…
A:
Q: 2. SWIMMER'S FLEXIBILITY STUDY Some statistics Before: mean = 19.4160; median = 18.46 After: mean =…
A: we will use shapiro wilk test for normality of data.
Q: INTERPRET the Descriptive Statisti
A: Variable P1: There are 5 observations under the variable P1. The minimum value for P1 is 55.80 The…
Q: For items 7-8: The Principal decided that the top 30% of the class with the highest grades in…
A:
Q: COVID-19 (novel corona virus) took the world by surprise in late 2019. By early 2020, nearly all…
A:
Q: The population of a certain country is about 40 million. Last year, the number of deaths due to…
A: Given that , The population of a certain country is about 40 million. Last year, the number of…
Q: 19. Identify the false claim about conditional probabilities, given that P(E) > 0 and P(-E) > 0. All…
A: Option a: PA|E>PA|E¯PA and EPE>PA and E¯PE¯PA and EPE>PA-PA and EPE¯PA and E>PA-PA and…
Q: Suppose that in a random sample of 600 employed Americans, there are 49 individuals who say that…
A:
Q: Each year, researchers at the U.S. Bureau of Labor Statistics (BLS) administer the American Time Use…
A: A researcher complied a random sample of 12 Americans and asked each person how much time they spent…
Q: Number of Jobs A sociologist found that in a sample of 45 retired men, the average number of jobs…
A:
Q: Exercises: Using only the information above (i.e., you are not expected to load the data into…
A: Since you have posted a question with multiple sub-parts, we will solve first three sub- parts for…
Q: A study aims to determine if a diet supplemented with phytase has a greater effect from the diet…
A: A random sample of 10 broilers were fed with the diet supplemented with phytase and another random…
Q: discuss the shape of the distribution of the variable WEIGHT.
A: From histogram we want to tell the shape of distribution
Complete the table given below

Step by step
Solved in 2 steps with 1 images
