According to a report from a business intelligence company, smartphone owners are using an average of 23 apps per month. Assume that number of apps used month by smartphone owners is normally distributed and that the standard deviation is 6. Complete parts (a) through (d) below. a. If you select a random sample of 16 smartphone owners, what is the probability that the sample mean is between 22.5 and 23.5? |259 (Round to three decimal places as needed.) b. If you select a random sample of 16 smartphone owners, what is the probability that the sample mean is between 22 and 23? 0.249 (Round to three decimal places as needed.) c. If you select a random sample of 100 smartphone owners, what is the probability that the sample mean is between 22.5 and 23.5? 0.593 (Round to three decimal places as needed.) d. Explain the difference in the results of (a) and (c). The sample size in (c) is greater than the sample size in (a), so the standard error of the mean (or the standard deviation of the sampling distribution) in (c) is greater than in (a). As the standard error decreases. values become more concentrated around the mean. Therefore, the probability that the sample mean fall close to the population mean will always increase when the sample size increases.
According to a report from a business intelligence company, smartphone owners are using an average of 23 apps per month. Assume that number of apps used month by smartphone owners is normally distributed and that the standard deviation is 6. Complete parts (a) through (d) below. a. If you select a random sample of 16 smartphone owners, what is the probability that the sample mean is between 22.5 and 23.5? |259 (Round to three decimal places as needed.) b. If you select a random sample of 16 smartphone owners, what is the probability that the sample mean is between 22 and 23? 0.249 (Round to three decimal places as needed.) c. If you select a random sample of 100 smartphone owners, what is the probability that the sample mean is between 22.5 and 23.5? 0.593 (Round to three decimal places as needed.) d. Explain the difference in the results of (a) and (c). The sample size in (c) is greater than the sample size in (a), so the standard error of the mean (or the standard deviation of the sampling distribution) in (c) is greater than in (a). As the standard error decreases. values become more concentrated around the mean. Therefore, the probability that the sample mean fall close to the population mean will always increase when the sample size increases.

MATLAB: An Introduction with Applications
6th Edition
ISBN:9781119256830
Author:Amos Gilat
Publisher:Amos Gilat
Chapter1: Starting With Matlab
Section: Chapter Questions
Problem 1P

Related questions
Question
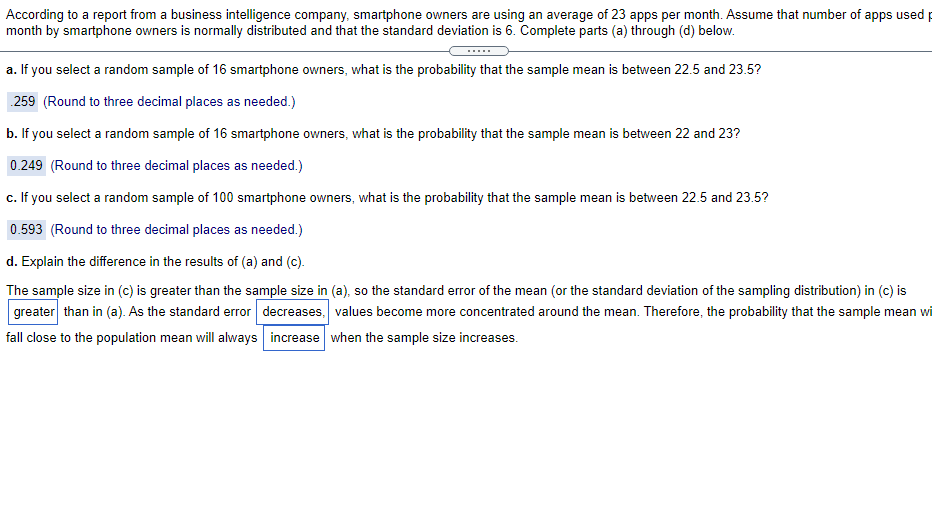
Transcribed Image Text:According to a report from a business intelligence company, smartphone owners are using an average of 23 apps per month. Assume that number of apps used
month by smartphone owners is normally distributed and that the standard deviation is 6. Complete parts (a) through (d) below.
a. If you select a random sample of 16 smartphone owners, what is the probability that the sample mean is between 22.5 and 23.5?
.259 (Round to three decimal places as needed.)
b. If you select a random sample of 16 smartphone owners, what is the probability that the sample mean is between 22 and 23?
0.249 (Round to three decimal places as needed.)
c. If you select a random sample of 100 smartphone owners, what is the probability that the sample mean is between 22.5 and 23.5?
0.593 (Round to three decimal places as needed.)
d. Explain the difference in the results of (a) and (c).
The sample size in (c) is greater than the sample size in (a), so the standard error of the mean (or the standard deviation of the sampling distribution) in (c) is
greater than in (a). As the standard error decreases, values become more concentrated around the mean. Therefore, the probability that the sample mean wi
fall close to the population mean will always increase when the sample size increases.
Expert Solution
This question has been solved!
Explore an expertly crafted, step-by-step solution for a thorough understanding of key concepts.

This is a popular solution!

Trending now
This is a popular solution!

Step by step
Solved in 5 steps

Follow-up Questions
Read through expert solutions to related follow-up questions below.
Follow-up Question
According to a report from a business intelligence company, smartphone owners are using an average of
normally distributed and that the standard deviation is
23
apps per month. Assume that number of apps used per month by smartphone owners is 5.
Complete parts (a) through (d) below.
Solution
Recommended textbooks for you
MATLAB: An Introduction with Applications
Statistics
ISBN:
9781119256830
Author:
Amos Gilat
Publisher:
John Wiley & Sons Inc

Probability and Statistics for Engineering and th…
Statistics
ISBN:
9781305251809
Author:
Jay L. Devore
Publisher:
Cengage Learning

Statistics for The Behavioral Sciences (MindTap C…
Statistics
ISBN:
9781305504912
Author:
Frederick J Gravetter, Larry B. Wallnau
Publisher:
Cengage Learning
MATLAB: An Introduction with Applications
Statistics
ISBN:
9781119256830
Author:
Amos Gilat
Publisher:
John Wiley & Sons Inc
Probability and Statistics for Engineering and th…
Statistics
ISBN:
9781305251809
Author:
Jay L. Devore
Publisher:
Cengage Learning
Statistics for The Behavioral Sciences (MindTap C…
Statistics
ISBN:
9781305504912
Author:
Frederick J Gravetter, Larry B. Wallnau
Publisher:
Cengage Learning

Elementary Statistics: Picturing the World (7th E…
Statistics
ISBN:
9780134683416
Author:
Ron Larson, Betsy Farber
Publisher:
PEARSON

The Basic Practice of Statistics
Statistics
ISBN:
9781319042578
Author:
David S. Moore, William I. Notz, Michael A. Fligner
Publisher:
W. H. Freeman

Introduction to the Practice of Statistics
Statistics
ISBN:
9781319013387
Author:
David S. Moore, George P. McCabe, Bruce A. Craig
Publisher:
W. H. Freeman