According to a retail organization, holiday shoppers spent an average of $935.58 over the Thanksgiving weekend in 2016. The accompanying data show the amount spent by a random sample of holiday shoppers during the same weekend in 2017. $1,029 $875 $969 $838 $825 $813 $962 $1,032 $990 $996 $921 $664 $1,013 $1,030 $979 $878 Complete parts a through c. Test the hypothesis that shoppers spent less than an average of $935.58 over the Thanksgiving weekend in 2017 using α=0.05.
According to a retail organization, holiday shoppers spent an average of $935.58 over the Thanksgiving weekend in 2016. The accompanying data show the amount spent by a random sample of holiday shoppers during the same weekend in 2017. $1,029 $875 $969 $838 $825 $813 $962 $1,032 $990 $996 $921 $664 $1,013 $1,030 $979 $878 Complete parts a through c. Test the hypothesis that shoppers spent less than an average of $935.58 over the Thanksgiving weekend in 2017 using α=0.05.

MATLAB: An Introduction with Applications
6th Edition
ISBN:9781119256830
Author:Amos Gilat
Publisher:Amos Gilat
Chapter1: Starting With Matlab
Section: Chapter Questions
Problem 1P

Related questions
Question
According to a retail organization, holiday shoppers spent an average of $935.58 over the Thanksgiving weekend in 2016. The accompanying data show the amount spent by a random sample of holiday shoppers during the same weekend in 2017.
|
$1,029 |
$875 |
$969 |
$838 |
$825 |
$813 |
|
|
$962 |
$1,032 |
$990 |
$996 |
$921 |
$664 |
|
|
$1,013 |
$1,030 |
$979 |
$878 |
Complete parts a through c.
- Test the hypothesis that shoppers spent less than an average of $935.58 over the Thanksgiving weekend in 2017 using α=0.05.
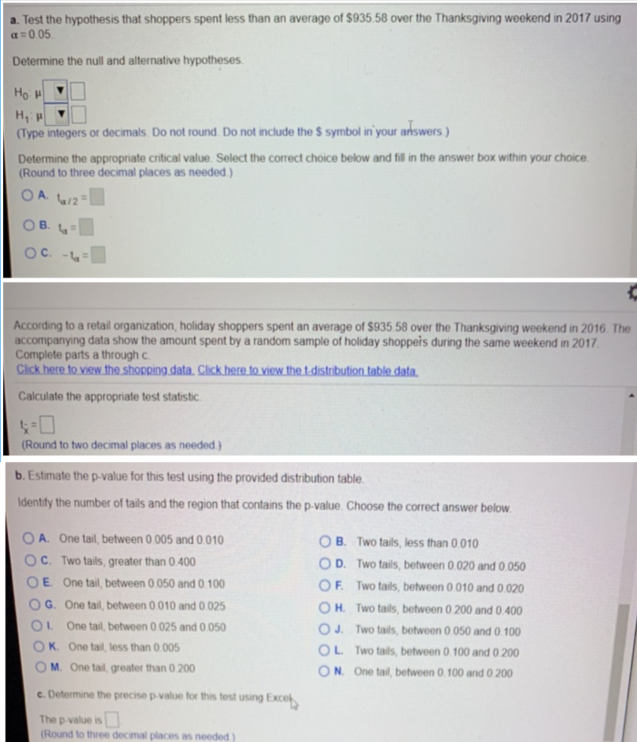
Transcribed Image Text:a. Test the hypothesis that shoppers spent less than an average of $935.58 over the Thanksgiving weokend in 2017 using
a = 0 05.
Determine the null and alternative hypotheses.
Ho H
H,
(Type integers or decimals. Do not round. Do not include the $ symbol in your answers )
Determine the appropriate critical value. Select the correct choice below and fill in the answer box within your choice.
(Round to three decimal places as needed.)
OA. 4/2=
OB.
OC. -4=
According to a retail organization, holiday shoppers spent an average of $935 58 over the Thanksgiving woekend in 2016. The
accompanying data show the amount spent by a random sample of holiday shoppeis during the same weekend in 2017.
Complete parts a through c.
Cick here to view the shopping data. Click here fo view the t.distribution tatble data.
Calculate the appropriate test statistic.
(Round to two decimal places as needed )
b. Estimate the p-value for this test using the provided distribution table.
Identify the number of tails and the region that contains the p-value Choose the correct answer below.
O A. One tail, between 0 005 and 0.010
OC. Two tails, greater than 0.400
OE One tail, between 0 050 and 0.100
O B. Two tails, less than 0.010
OD. Two tails, between 0.020 and 0.050
OF. Two tails, between 0 010 and 0.020
OH. Two tails, between 0 200 and 0.400
OJ. Two tails, between 0.050 and 0.100
OL Two tails, between 0.100 and 0 200
ON. One tail, between 0.100 and 0 200
OG. One tail, between 0.010 and 0 025
OL One tail, between 0 025 and 0 050
OK. One tail, less than 0.005
M. One tail, greater than 0 200
c. Determine the precise p-value for this test using Excel
The p-value is
(Round to three decimal places as needed)
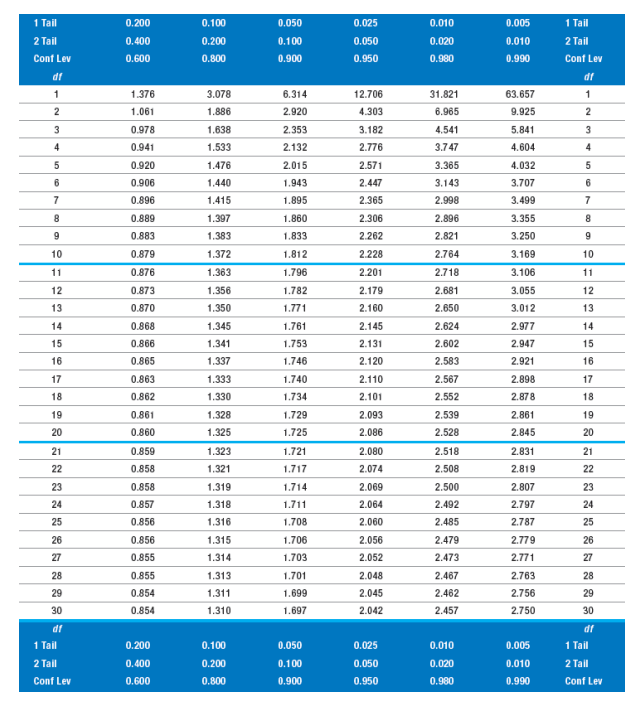
Transcribed Image Text:1 Tail
0.200
0.100
0.050
0.025
0.010
0.005
1 Tail
2 Tail
0.400
0.200
0.100
0.050
0.020
0.010
2 Tail
Conf Lev
0.600
0.800
0.900
0.950
0.980
0.990
Conf Lev
df
df
1
1.376
3.078
6.314
12.706
31.821
63.657
1.061
1.886
2.920
4.303
6.965
9.925
2
0.978
1.638
2.353
3.182
4.541
5.841
3
4
0.941
1.533
2.132
2.776
3.747
4.604
4
0.920
1.476
2.015
2.571
3.365
4.032
5
0.906
1.440
1.943
2.447
3.143
3.707
7
0.896
1.415
1.895
2.365
2.998
3.499
7
0.889
1.397
1.860
2.306
2.896
3.355
0.883
1.383
1.833
2.262
2.821
3.250
10
0.879
1.372
1.812
2.228
2.764
3.169
10
11
0.876
1.363
1.796
2.201
2.718
3.106
11
12
0.873
1.356
1.782
2.179
2.681
3.055
12
13
0.870
1.350
1.771
2.160
2.650
3.012
13
14
0.868
1.345
1.761
2.145
2.624
2.977
14
15
0.866
1.341
1.753
2.131
2.602
2.947
15
16
0.865
1.337
1.746
2.120
2.583
2.921
16
17
0.863
1.333
1.740
2.110
2.567
2.898
17
18
0.862
1.330
1.734
2.101
2.552
2.878
18
19
0.861
1.328
1.729
2.093
2.539
2.861
19
20
0.860
1.325
1.725
2.086
2.528
2.845
20
21
0.859
1.323
1.721
2.080
2.518
2.831
21
22
0.858
1.321
1.717
2.074
2.508
2.819
22
23
0.858
1.319
1.714
2.069
2.500
2.807
23
24
0.857
1.318
1.711
2.064
2.492
2.797
24
25
0.856
1.316
1.708
2.060
2.485
2.787
25
26
0.856
1.315
1.706
2.056
2.479
2.779
26
27
0.855
1.314
1.703
2.052
2.473
2.771
27
28
0.855
1.313
1.701
2.048
2.467
2.763
28
29
0.854
1.311
1.699
2.045
2.462
2.756
29
30
0.854
1.310
1.697
2.042
2.457
2.750
30
df
df
1 Tail
0.200
0.100
0.050
0.025
0.010
0.005
1 Tail
2 Tail
0.400
0.200
0.100
0.050
0.020
0.010
2 Tail
Conf Lev
0.600
0.800
0.900
0.950
0.980
0.990
Conf Lev
Expert Solution
This question has been solved!
Explore an expertly crafted, step-by-step solution for a thorough understanding of key concepts.

This is a popular solution!

Trending now
This is a popular solution!

Step by step
Solved in 6 steps with 2 images

Recommended textbooks for you
MATLAB: An Introduction with Applications
Statistics
ISBN:
9781119256830
Author:
Amos Gilat
Publisher:
John Wiley & Sons Inc

Probability and Statistics for Engineering and th…
Statistics
ISBN:
9781305251809
Author:
Jay L. Devore
Publisher:
Cengage Learning

Statistics for The Behavioral Sciences (MindTap C…
Statistics
ISBN:
9781305504912
Author:
Frederick J Gravetter, Larry B. Wallnau
Publisher:
Cengage Learning
MATLAB: An Introduction with Applications
Statistics
ISBN:
9781119256830
Author:
Amos Gilat
Publisher:
John Wiley & Sons Inc
Probability and Statistics for Engineering and th…
Statistics
ISBN:
9781305251809
Author:
Jay L. Devore
Publisher:
Cengage Learning
Statistics for The Behavioral Sciences (MindTap C…
Statistics
ISBN:
9781305504912
Author:
Frederick J Gravetter, Larry B. Wallnau
Publisher:
Cengage Learning

Elementary Statistics: Picturing the World (7th E…
Statistics
ISBN:
9780134683416
Author:
Ron Larson, Betsy Farber
Publisher:
PEARSON

The Basic Practice of Statistics
Statistics
ISBN:
9781319042578
Author:
David S. Moore, William I. Notz, Michael A. Fligner
Publisher:
W. H. Freeman

Introduction to the Practice of Statistics
Statistics
ISBN:
9781319013387
Author:
David S. Moore, George P. McCabe, Bruce A. Craig
Publisher:
W. H. Freeman