According to an article in Bloomberg Businessweek, New York City's most recent adult smoking rate is 14%. Suppose that a survey is conducted to determine this year's rate. Nine out of 70 randomly chosen N. Y. City residents reply that they smoke. Conduct a hypothesis test at the 5% level to determine if the rate is still 14% or if it has decreased. Note: If you are using a Student's t-distribution for the problem, you may assume that the underlying population is normally distributed. (In general, you must first prove that assumption, though.) O Part (a) O Part (b) O Part (c) O Part (d) State the distribution to use for the test. (Round your answers to four decimal places.) P'- O Part (e) What is the test statistic? (If using the z distribution round your answers to two decimal places, and if using the t distribution round your answers to three decimal places.) O Part (f) What is the p-value? (Round your answer to four decimal places.) Explain what the p-value means for this problem. O If Ho is true, then there is a chance equal to the p-value that the proportion of smokers in New York City is at least as different as the sample proportion is from 14%. O If H, is false, then there is a chance equal to the p-value that the proportion of smokers in New York City is at least as different as the sample proportion is from 14%. O If H, is false, then there is a chance equal to the p-value that the proportion of smokers in New York City is not at least as different as the sample proportion is from 14%.
According to an article in Bloomberg Businessweek, New York City's most recent adult smoking rate is 14%. Suppose that a survey is conducted to determine this year's rate. Nine out of 70 randomly chosen N. Y. City residents reply that they smoke. Conduct a hypothesis test at the 5% level to determine if the rate is still 14% or if it has decreased. Note: If you are using a Student's t-distribution for the problem, you may assume that the underlying population is normally distributed. (In general, you must first prove that assumption, though.) O Part (a) O Part (b) O Part (c) O Part (d) State the distribution to use for the test. (Round your answers to four decimal places.) P'- O Part (e) What is the test statistic? (If using the z distribution round your answers to two decimal places, and if using the t distribution round your answers to three decimal places.) O Part (f) What is the p-value? (Round your answer to four decimal places.) Explain what the p-value means for this problem. O If Ho is true, then there is a chance equal to the p-value that the proportion of smokers in New York City is at least as different as the sample proportion is from 14%. O If H, is false, then there is a chance equal to the p-value that the proportion of smokers in New York City is at least as different as the sample proportion is from 14%. O If H, is false, then there is a chance equal to the p-value that the proportion of smokers in New York City is not at least as different as the sample proportion is from 14%.

Chapter9: Sequences, Probability And Counting Theory
Section9.7: Probability
Problem 1SE: What term is used to express the likelihood of an event occurring? Are there restrictions on its...

Related questions
Question
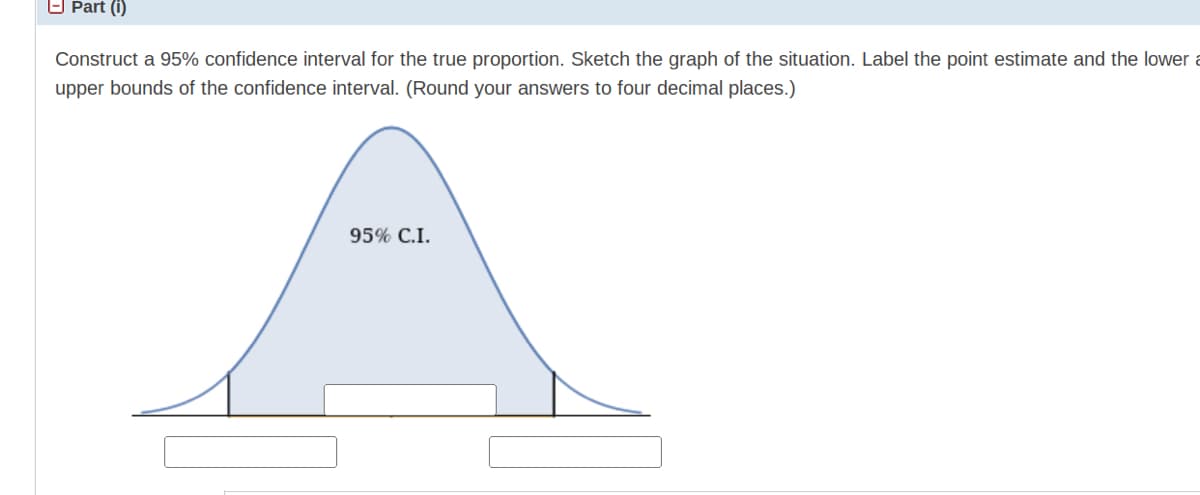
Transcribed Image Text:O Part (i)
Construct a 95% confidence interval for the true proportion. Sketch the graph of the situation. Label the point estimate and the lower a
upper bounds of the confidence interval. (Round your answers to four decimal places.)
95% C.I.
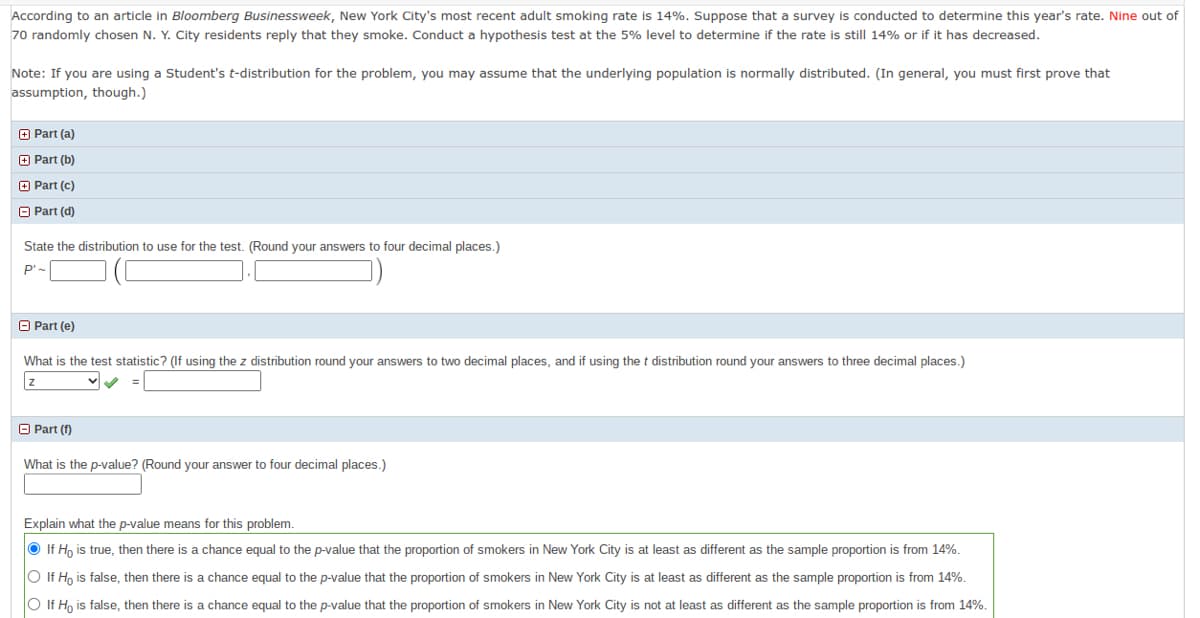
Transcribed Image Text:According to an article in Bloomberg Businessweek, New York City's most recent adult smoking rate is 14%. Suppose that a survey is conducted to determine this year's rate. Nine out of
70 randomly chosen N. Y. City residents reply that they smoke. Conduct a hypothesis test at the 5% level to determine if the rate is still 14% or if it has decreased.
Note: If you are using a Student's t-distribution for the problem, you may assume that the underlying population is normally distributed. (In general, you must first prove that
assumption, though.)
O Part (a)
O Part (b)
O Part (c)
O Part (d)
State the distribution to use for the test. (Round your answers to four decimal places.)
P'-
O Part (e)
What is the test statistic? (If using the z distribution round your answers to two decimal places, and if using the t distribution round your answers to three decimal places.)
O Part (f)
What is the p-value? (Round your answer to four decimal places.)
Explain what the p-value means for this problem.
O If Ho is true, then there is a chance equal to the p-value that the proportion of smokers in New York City is at least as different as the sample proportion is from 14%.
O If H, is false, then there is a chance equal to the p-value that the proportion of smokers in New York City is at least as different as the sample proportion is from 14%.
O If Ho is false, then there is a chance equal to the p-value that the proportion of smokers in New York City is not at least as different as the sample proportion is from 14%.
Expert Solution
This question has been solved!
Explore an expertly crafted, step-by-step solution for a thorough understanding of key concepts.

This is a popular solution!

Trending now
This is a popular solution!

Step by step
Solved in 5 steps with 4 images

Recommended textbooks for you