According to the May 16,2017 report by Pew Research, 68% of US adults say solar energy is very effective in minimizing air pollution. A sample of 240 U.S adults are surveyed. Let p be the sample proportion of Americans who believe solar energy is very effective in minimizing air pollution. 1. What is the population proportion? (decimal form) 2. What is the sample size? 3. Can the normal approximation be used with this distribution? 4. What is the mean of the sampling proportion? 5. What is the standard deviation of the sampling proportion? (Round to 4th decimal place) 6. What is the probability that no more than 156 U.S adults of the 240 surveyed believe solar energy is very effective in minimizing air pollution? What is p? (decimal form) What is the z-score? (Round to the hundredths place) What is the probability that no more than 156 U.S. adults of the 240 surveyed believe solar energy is very effective in minimizing air pollution? (decimal form)
According to the May 16,2017 report by Pew Research, 68% of US adults say solar energy is very effective in minimizing air pollution. A sample of 240 U.S adults are surveyed. Let p be the sample proportion of Americans who believe solar energy is very effective in minimizing air pollution. 1. What is the population proportion? (decimal form) 2. What is the sample size? 3. Can the normal approximation be used with this distribution? 4. What is the mean of the sampling proportion? 5. What is the standard deviation of the sampling proportion? (Round to 4th decimal place) 6. What is the probability that no more than 156 U.S adults of the 240 surveyed believe solar energy is very effective in minimizing air pollution? What is p? (decimal form) What is the z-score? (Round to the hundredths place) What is the probability that no more than 156 U.S. adults of the 240 surveyed believe solar energy is very effective in minimizing air pollution? (decimal form)

Holt Mcdougal Larson Pre-algebra: Student Edition 2012
1st Edition
ISBN:9780547587776
Author:HOLT MCDOUGAL
Publisher:HOLT MCDOUGAL
Chapter11: Data Analysis And Probability
Section11.4: Collecting Data
Problem 6E

Related questions

Concept explainers
Contingency Table
A contingency table can be defined as the visual representation of the relationship between two or more categorical variables that can be evaluated and registered. It is a categorical version of the scatterplot, which is used to investigate the linear relationship between two variables. A contingency table is indeed a type of frequency distribution table that displays two variables at the same time.
Binomial Distribution
Binomial is an algebraic expression of the sum or the difference of two terms. Before knowing about binomial distribution, we must know about the binomial theorem.
Topic Video
Question
100%
Need help Q9
Transcribed Image Text:Standard K
S Binomial
Tn Unit 4 Te x
E RoundinX
Asode genius.unrooms.net/mod/quiz/attemptphp?...
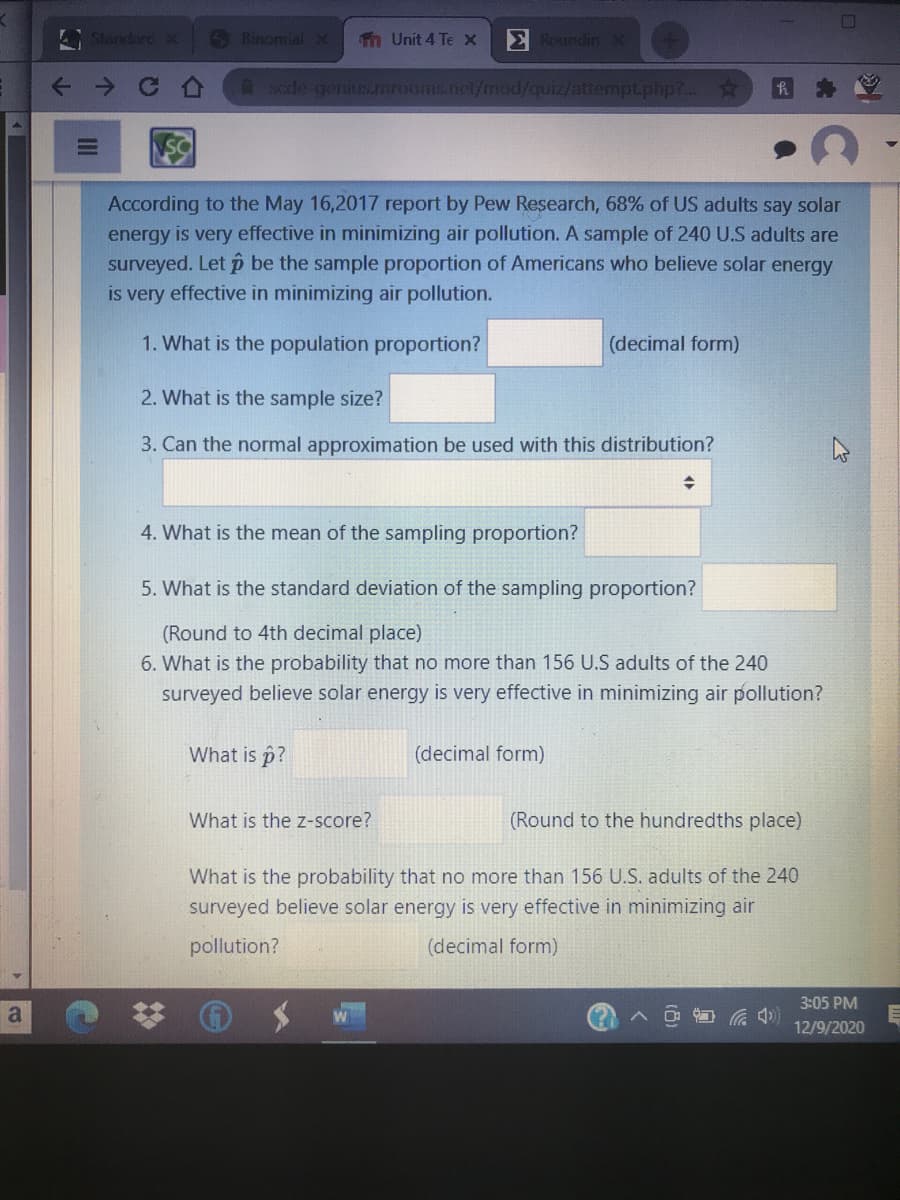
According to the May 16,2017 report by Pew Research, 68% of US adults say solar
energy is very effective in minimizing air pollution. A sample of 240 U.S adults are
surveyed. Let p be the sample proportion of Americans who believe solar energy
is very effective in minimizing air pollution.
1. What is the population proportion?
(decimal form)
2. What is the sample size?
3. Can the normal approximation be used with this distribution?
4. What is the mean of the sampling proportion?
5. What is the standard deviation of the sampling proportion?
(Round to 4th decimal place)
6. What is the probability that no more than 156 U.S adults of the 240
surveyed believe solar energy is very effective in minimizing air pollution?
What is p?
(decimal form)
What is the z-score?
(Round to the hundredths place)
What is the probability that no more than 156 U.S. adults of the 240
surveyed believe solar energy is very effective in minimizing air
pollution?
(decimal form)
3:05 PM
a
12/9/2020
Expert Solution
This question has been solved!
Explore an expertly crafted, step-by-step solution for a thorough understanding of key concepts.

This is a popular solution!

Trending now
This is a popular solution!

Step by step
Solved in 2 steps

Knowledge Booster


Learn more about
Need a deep-dive on the concept behind this application? Look no further. Learn more about this topic, statistics and related others by exploring similar questions and additional content below.Recommended textbooks for you
Holt Mcdougal Larson Pre-algebra: Student Edition…
Algebra
ISBN:
9780547587776
Author:
HOLT MCDOUGAL
Publisher:
HOLT MCDOUGAL

College Algebra (MindTap Course List)
Algebra
ISBN:
9781305652231
Author:
R. David Gustafson, Jeff Hughes
Publisher:
Cengage Learning

Holt Mcdougal Larson Pre-algebra: Student Edition…
Algebra
ISBN:
9780547587776
Author:
HOLT MCDOUGAL
Publisher:
HOLT MCDOUGAL
College Algebra (MindTap Course List)
Algebra
ISBN:
9781305652231
Author:
R. David Gustafson, Jeff Hughes
Publisher:
Cengage Learning