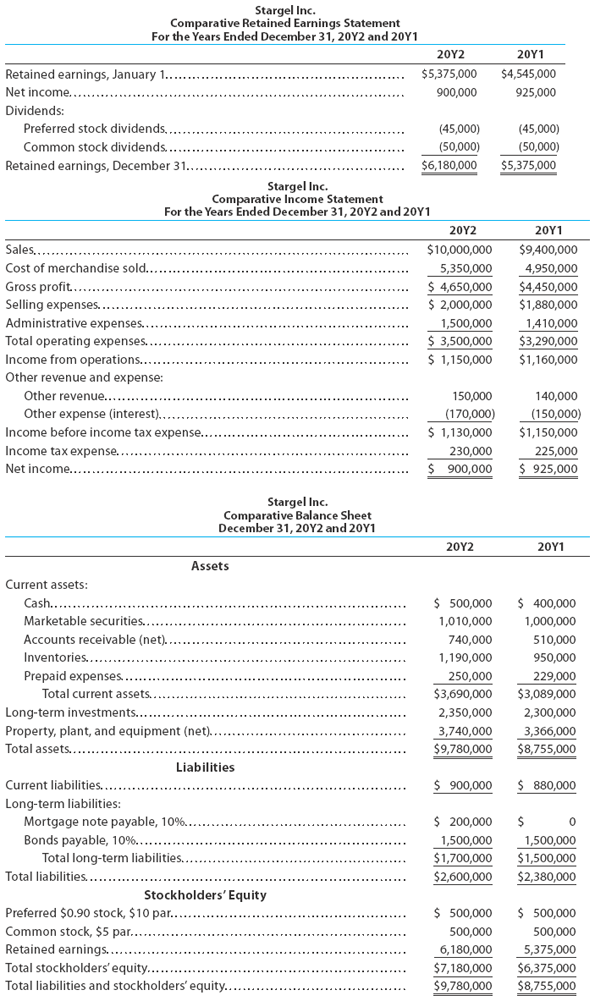
Stargel Inc. Comparative Retained Earnings Statement For the Years Ended December 31, 20Y2 and 20Y1 20Υ2 20Υ1 Retained earnings, January 1..... $5,375,000 $4,545,000 Net income... 900,000 925,000 Dividends: Preferred stock dividends, (45,000) (45,000) Common stock dividends... (50,000) (50,000) Retained earnings, December 31.... $6,180,000 $5,375,000 Stargel Inc. Comparative Income Statement For the Years Ended December 31, 20Y2 and 20Y1 20Υ2 20Υ1 Sales........ Cost of merchandise sold... Gross profit.. Selling expenses... Administrative expenses.. Total operating expenses. Income from operations. Other revenue and expense: $10,000,000 $9,400,000 5,350,000 4,950,000 $ 4,650,000 $ 2,000,000 $4,450,000 $1,880,000 1,500,000 $ 3,500,000 $ 1,150,000 1,410,000 $3,290,000 $1,160,000 Other revenue......... 150,000 140,000 Other expense (interest)., Income before income tax expense... (170,000) $ 1,130,000 (150,000) $1,150,000 Income tax expense.... Net income.. $ 900,000 230,000 225,000 $ 925.000 Stargel Inc. Comparative Balance Sheet December 31, 20Y2 and 20Y1 20Y2 20Υ1 Assets Current assets: Cash..... $ 500,000 $ 400,000 Marketable securities.. 1,010,000 1,000,000 Accounts receivable (net).. 740,000 510,000 . Inventories... 1,190,000 950,000 Prepaid expenses. 250,000 $3,690,000 229,000 Total current assets.. $3,089,000 Long-term investments.... 2,350,000 2,300,000 Property, plant, and equipment (net). 3,366,000 Total assets.... 3,740,000 $9,780,000 $8,755,000 Liabilities Current liabilities... $ 900,000 $ 880,000 Long-term liabilities: Mortgage note payable, 10%.... Bonds payable, 10%.. Total long-term liabilities.... $ 200,000 1,500,000 1,500,000 $1,700,000 $2,600,000 $1,500,000 Total liabilities... $2,380,000 Stockholders' Equity $ 500,000 $ 500,000 Preferred $0.90 stock, $10 par.. Common stock, $5 par... Retained earnings...... Total stockholders' equity....... Total liabilities and stockholders' equity... 500,000 500,000 6,180,000 $7,180,000 $9,780,000 5,375,000 $6,375,000 $8,755,000


Please select THREE of the ratios listed below and perform them for years 2012 and 2011. Please interpret the data by including the following:
(1) Write out the formula for each ratio you selected and show your calculations.
(2) Discuss whether each ratio you selected measures liquidity or profitability and what those terms mean.
(3) What factor(s) contributed to the increase or decrease from last year? Discuss whether those changes were favorable or unfavorable to the company and why?
(4) What does each of your calculated ratios potentially mean for the company’s overall financial condition?
Please assume the market price of the common stock on 12/31/11 was $113.40.
Also, if you need any numbers from 2010 for averages, please use the following:
|
Cash 300,000 Marketable securities 1,000,000 A/R 345,000 Inventory 647,000 Prepaids 220,000 Total current assets 2,512,000
Long-term investments 2,300,000 Prop, plant, and equip 3,000,000
TOTAL ASSETS 7,812,000 |
Current liabilities 800,000
Long-term liabilities: Mortgage N/P 0 Bonds Payable 1,500,000 Total LT liabilities 1,500,000 TOTAL LIABILITIES 2,300,000
Preferred 500,000 Common 500,000 Total stockholders' eq 5,512,000
TOTAL LIAB & EQUITY 7,812,000
|
Make sure you indicate which ratios you have chosen. It is okay to repeat a ratio that has already been presented because you may feel it is important and you may have additional insight to offer. Please also try to choose at least one ratio that has not been written about yet. Let's see if we can get to all of them.
- Accounts Receivable Turnover
Current Ratio - Inventory Turnover
- Number of Days’ Sales in Inventory
- Number of Days’ Sales in Receivables
- Number of Times Interest Charges Are Earned
- Number of Times Preferred Dividends Are Earned
- Quick Ratio
- Ratio of Fixed Assets to Long-Term Liabilities
- Ratio of Liabilities to Owner’s (
Stockholders’) Equity Working Capital - Dividend Yield
- Dividends per Share
- Earnings per Share (EPS) on Common Stock
- Price-Earnings (P/E) Ratio
- Ratio of Sales to Assets
- Rate Earned on Common Stockholders’ Equity
- Rate Earned on Stockholders’ Equity
- Rate Earned on Total Assets


Trending now
This is a popular solution!

Step by step
Solved in 2 steps


