Activity 1 Directions: Answer the following question. Use Microsoft Excel if necessary. 1. An insurance company would like to determine the proportion of all medical doctors who have been involved in one or more malpractice lawsuits. The company selects 500 doctors at random from a professional directory and determines the number in the sample who have been involved in a malpractice lawsuit. Identify the following: a. Population b. Sample c. Variable d. Level of Measurement used 2. Determine the correct data type (quantitative or qualitative). Indicate whether quantitative data are continuous or discrete the following: a. the number of pairs of shoes you own b. the type of car you drive c. the distance from your home to the nearest grocery store 3. The Whitcomb Company manufactures a metal ring for industrial engines that usually weighs about 50 ounces. A random sample of 50 of these metal rings produced the following weights (in ounces). 50 44 47 57 46 5 56 50 57 53 56 53 53 42 41 4 52 44 46 41 52 69 53 57 54 63 42 47 47 52 53 46 36 58 5I 49 s0 62 9 44 55 43 52 43 42 49 Construct grouped and ungrouped frequency distribution table for the data and interpret the result.
Activity 1 Directions: Answer the following question. Use Microsoft Excel if necessary. 1. An insurance company would like to determine the proportion of all medical doctors who have been involved in one or more malpractice lawsuits. The company selects 500 doctors at random from a professional directory and determines the number in the sample who have been involved in a malpractice lawsuit. Identify the following: a. Population b. Sample c. Variable d. Level of Measurement used 2. Determine the correct data type (quantitative or qualitative). Indicate whether quantitative data are continuous or discrete the following: a. the number of pairs of shoes you own b. the type of car you drive c. the distance from your home to the nearest grocery store 3. The Whitcomb Company manufactures a metal ring for industrial engines that usually weighs about 50 ounces. A random sample of 50 of these metal rings produced the following weights (in ounces). 50 44 47 57 46 5 56 50 57 53 56 53 53 42 41 4 52 44 46 41 52 69 53 57 54 63 42 47 47 52 53 46 36 58 5I 49 s0 62 9 44 55 43 52 43 42 49 Construct grouped and ungrouped frequency distribution table for the data and interpret the result.

Holt Mcdougal Larson Pre-algebra: Student Edition 2012
1st Edition
ISBN:9780547587776
Author:HOLT MCDOUGAL
Publisher:HOLT MCDOUGAL
Chapter11: Data Analysis And Probability
Section11.4: Collecting Data
Problem 8E

Related questions
Question
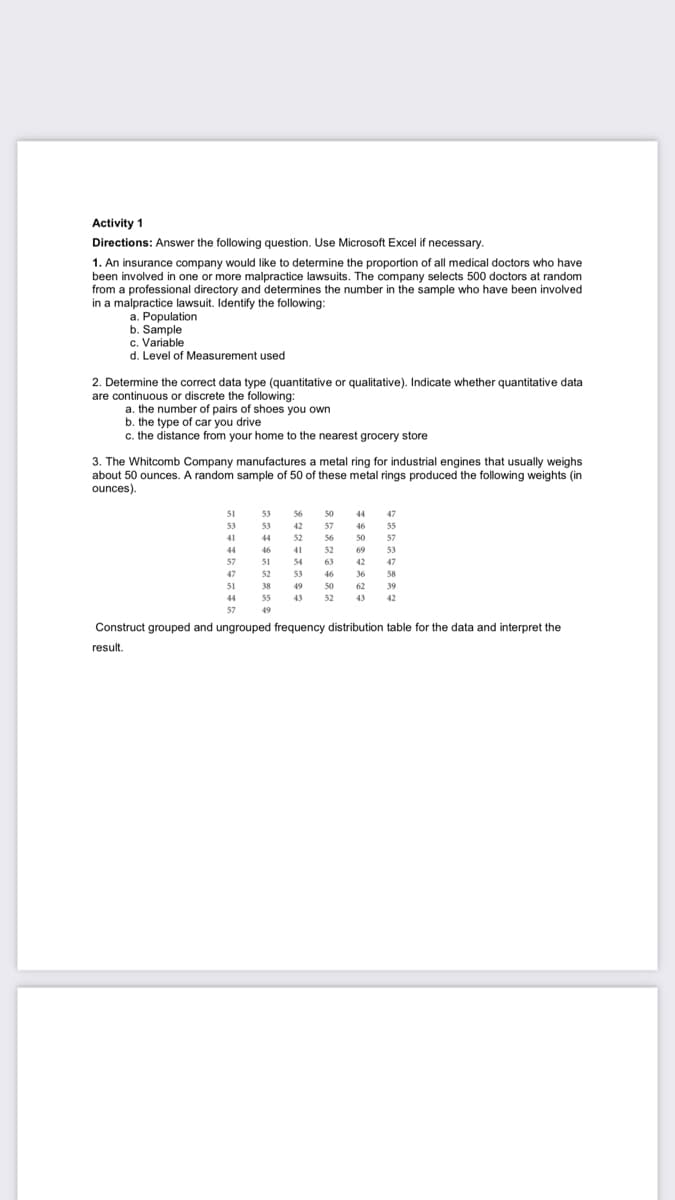
Transcribed Image Text:Activity 1
Directions: Answer the following question. Use Microsoft Excel if necessary.
1. An insurance company would like to determine the proportion of all medical doctors who have
been involved in one or more malpractice lawsuits. The company selects 500 doctors at random
from a professional directory and determines the number in the sample who have been involved
in a malpractice lawsuit. Identify the following:
a. Population
b. Sample
c. Variable
d. Level of Measurement used
2. Determine the correct data type (quantitative or qualitative). Indicate whether quantitative data
are continuous or discrete the following:
a. the number of pairs of shoes you own
b. the type of car you drive
c. the distance from your home to the nearest grocery store
3. The Whitcomb Company manufactures a metal ring for industrial engines that usually weig
about 50 ounces. A random sample of 50 of these metal rings produced the following weights (in
ounces).
51
53
56
50
44
47
53
53
42
57
46
55
41
44
52 56 50
57
44
46
41
52
69
53
57
51
54
63
42
47
47
52
53
46 36
58
51
38
49 50 62 39
44
55
43
52 43 42
57
49
Construct grouped and ungrouped frequency distribution table for the data and interpret the
result.
Expert Solution
This question has been solved!
Explore an expertly crafted, step-by-step solution for a thorough understanding of key concepts.

This is a popular solution!

Trending now
This is a popular solution!

Step by step
Solved in 2 steps

Recommended textbooks for you
Holt Mcdougal Larson Pre-algebra: Student Edition…
Algebra
ISBN:
9780547587776
Author:
HOLT MCDOUGAL
Publisher:
HOLT MCDOUGAL

Glencoe Algebra 1, Student Edition, 9780079039897…
Algebra
ISBN:
9780079039897
Author:
Carter
Publisher:
McGraw Hill

Big Ideas Math A Bridge To Success Algebra 1: Stu…
Algebra
ISBN:
9781680331141
Author:
HOUGHTON MIFFLIN HARCOURT
Publisher:
Houghton Mifflin Harcourt
Holt Mcdougal Larson Pre-algebra: Student Edition…
Algebra
ISBN:
9780547587776
Author:
HOLT MCDOUGAL
Publisher:
HOLT MCDOUGAL
Glencoe Algebra 1, Student Edition, 9780079039897…
Algebra
ISBN:
9780079039897
Author:
Carter
Publisher:
McGraw Hill
Big Ideas Math A Bridge To Success Algebra 1: Stu…
Algebra
ISBN:
9781680331141
Author:
HOUGHTON MIFFLIN HARCOURT
Publisher:
Houghton Mifflin Harcourt