Activity 1.2: Check On Directions: Check whether the sample in each problem is sufficiently Targe enough to use the Central Limit Theorem in normal approximation. Write SLS if it is sufficiently large sample,. if not write the condition/s that tow.neld knieti ort cpend their extra d like to 2. Pedro made o in the beel inin d found out mat 2 tuo loorlosgit1oine that 4 lsnoo of eanebive ou ute 4. A social worker reports that 5% of workers in a factory are below 21 years of age. Of the 70 employees surveyed, 10 said they are below 21 years old. on steoibni 5. It is believed that in the coming election, 75% of the voters in the Province of llocos Norte will vote for the administrative candidate for governor. Out of 1,170 randomly selected voters, 740 indicated that they would vote for the administrative candidate.
Activity 1.2: Check On Directions: Check whether the sample in each problem is sufficiently Targe enough to use the Central Limit Theorem in normal approximation. Write SLS if it is sufficiently large sample,. if not write the condition/s that tow.neld knieti ort cpend their extra d like to 2. Pedro made o in the beel inin d found out mat 2 tuo loorlosgit1oine that 4 lsnoo of eanebive ou ute 4. A social worker reports that 5% of workers in a factory are below 21 years of age. Of the 70 employees surveyed, 10 said they are below 21 years old. on steoibni 5. It is believed that in the coming election, 75% of the voters in the Province of llocos Norte will vote for the administrative candidate for governor. Out of 1,170 randomly selected voters, 740 indicated that they would vote for the administrative candidate.

Glencoe Algebra 1, Student Edition, 9780079039897, 0079039898, 2018
18th Edition
ISBN:9780079039897
Author:Carter
Publisher:Carter
Chapter10: Statistics
Section10.1: Measures Of Center
Problem 9PPS

Related questions
Question
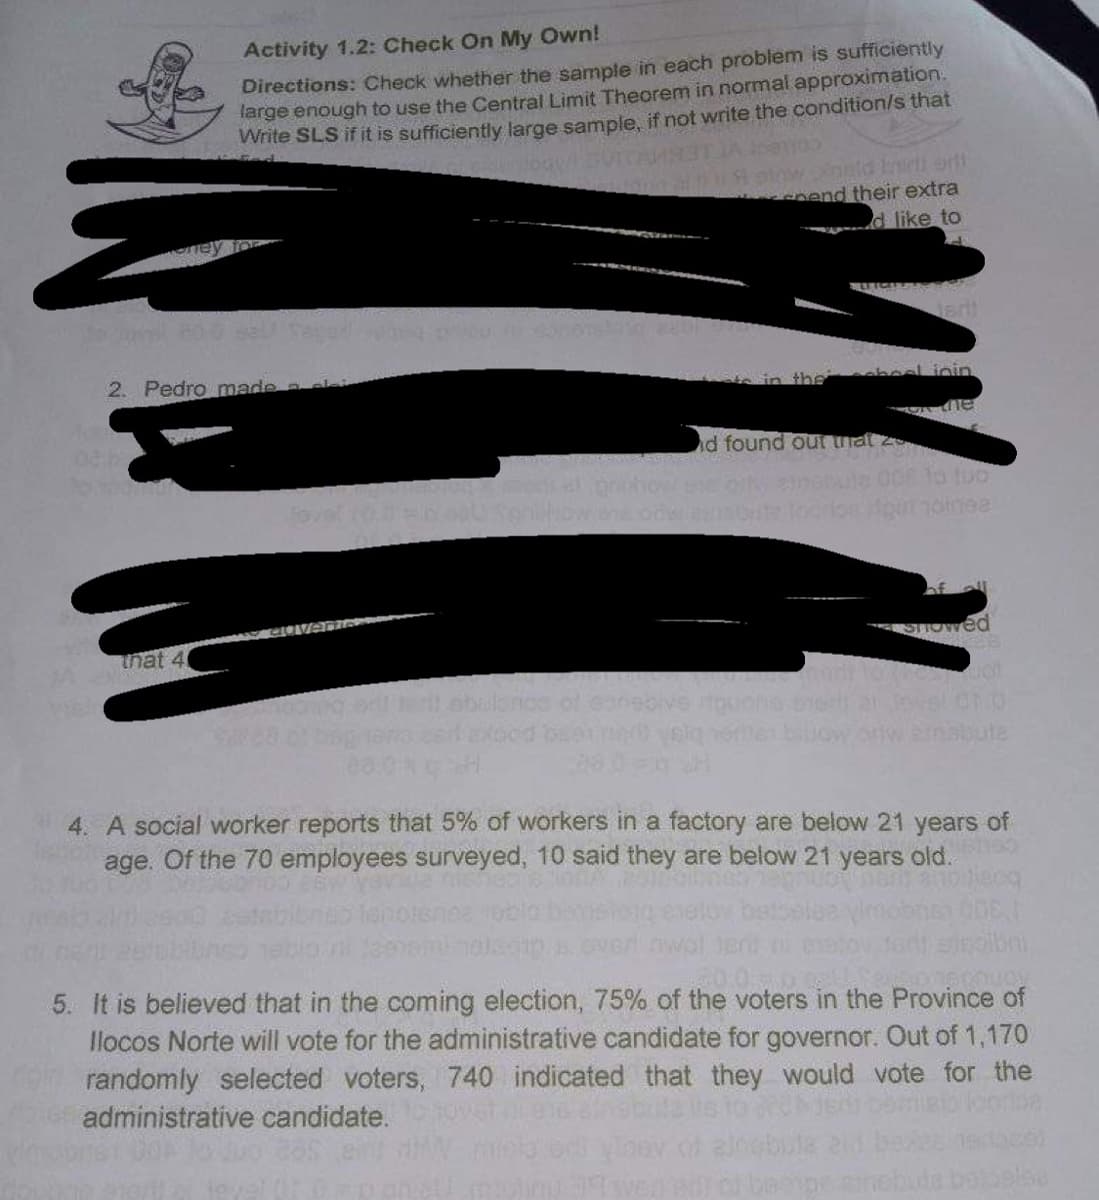
Transcribed Image Text:Activity 1.2: Check On My Own!
Directions: Check whether the sample in each problem is sufficiently
large enough to use the Central Limit Theorem in normal approximation.
Write SLS if it is sufficiently large sample, if not write the condition/s that
nend their extra
d like to
2. Pedro made
the
cheel inin
the
id found out that
one odwievisorite foorlos rigirt noinee
showed
that 40
alance of eanebive riquons-oneri ar jovel of or
4. A social worker reports that 5% of workers in a factory are below 21 years of
age. Of the 70 employees surveyed, 10 said they are below 21 years old.
5. It is believed that in the coming election, 75% of the voters in the Province of
Ilocos Norte will vote for the administrative candidate for governor. Out of 1,170
randomly selected voters, 740 indicated that they would vote for the
administrative candidate.
( a p'anali maslinu 37 sen en) of besige sinebude
Expert Solution
This question has been solved!
Explore an expertly crafted, step-by-step solution for a thorough understanding of key concepts.

Step by step
Solved in 2 steps with 2 images

Recommended textbooks for you
Glencoe Algebra 1, Student Edition, 9780079039897…
Algebra
ISBN:
9780079039897
Author:
Carter
Publisher:
McGraw Hill
Glencoe Algebra 1, Student Edition, 9780079039897…
Algebra
ISBN:
9780079039897
Author:
Carter
Publisher:
McGraw Hill