Activity 2.1: Be Critical! Directions: Determine the critical value and illustrate the rejection region under the normal curve by using the given information. Critical Value: ^ Critical Value: Critical Value: Critical Value: Critical Value: 1. Ha: P α = 0.01 Ha: p > 0.50 α = 0.05 Ha: p = 0.70 a = 0.05 Ha: p < 0.55 a = 0.10 Ha: p = 0.43 a = 0.01 2
Activity 2.1: Be Critical! Directions: Determine the critical value and illustrate the rejection region under the normal curve by using the given information. Critical Value: ^ Critical Value: Critical Value: Critical Value: Critical Value: 1. Ha: P α = 0.01 Ha: p > 0.50 α = 0.05 Ha: p = 0.70 a = 0.05 Ha: p < 0.55 a = 0.10 Ha: p = 0.43 a = 0.01 2

MATLAB: An Introduction with Applications
6th Edition
ISBN:9781119256830
Author:Amos Gilat
Publisher:Amos Gilat
Chapter1: Starting With Matlab
Section: Chapter Questions
Problem 1P

Related questions
Question
100%
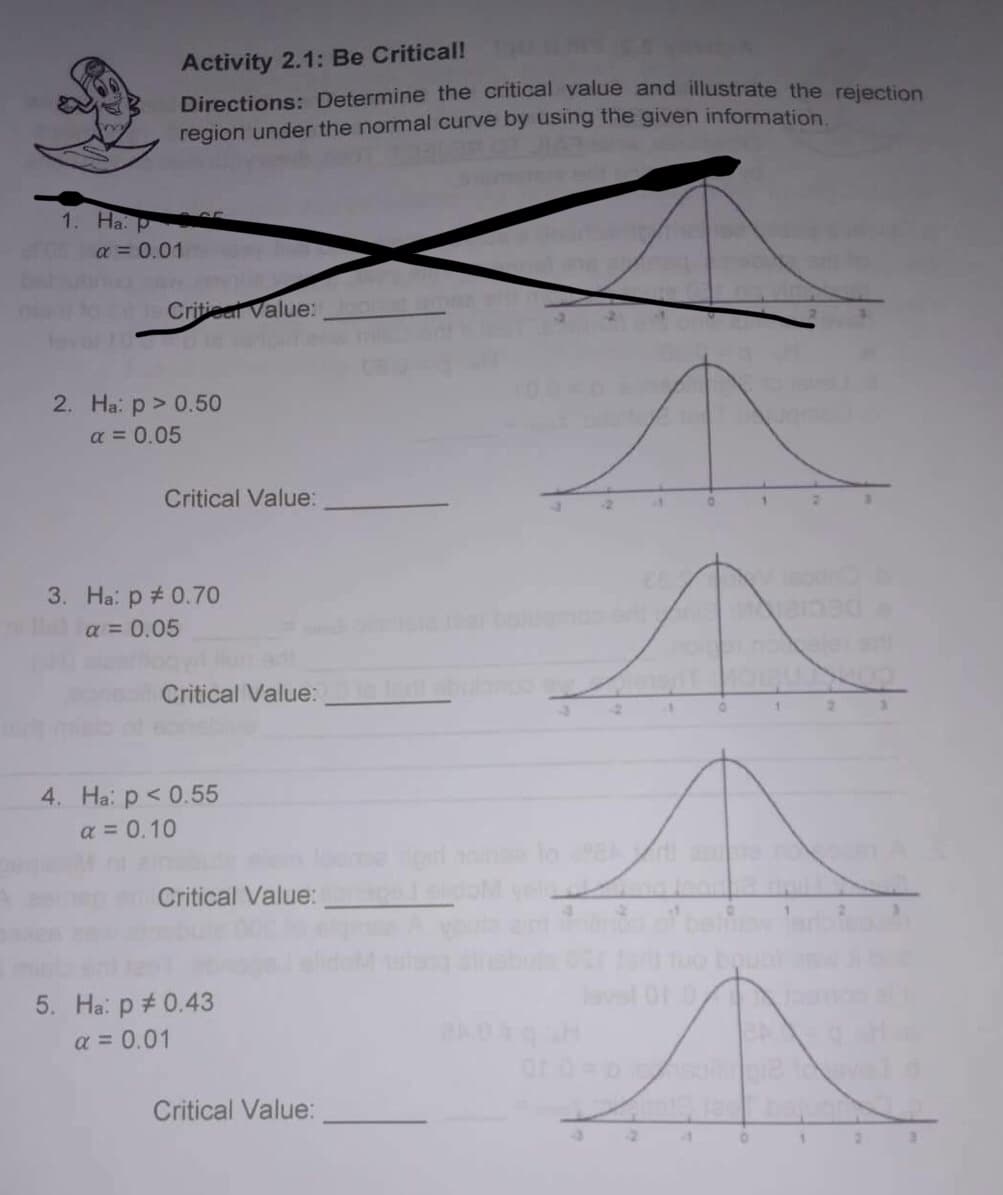
Transcribed Image Text:Activity 2.1: Be Critical!
Directions: Determine the critical value and illustrate the rejection
region under the normal curve by using the given information.
Critical Value:
Critical Value:
Critical Value:
2
Critical Value:
Critical Value:
1. Ha: pr
α = 0.01
2. Ha: p > 0.50
α = 0.05
3. Ha: p = 0.70
a = 0.05
4. Ha: p < 0.55
a = 0.10
5. Ha: p = 0.43
a = 0.01
Expert Solution
This question has been solved!
Explore an expertly crafted, step-by-step solution for a thorough understanding of key concepts.

This is a popular solution!

Trending now
This is a popular solution!

Step by step
Solved in 3 steps with 3 images

Recommended textbooks for you
MATLAB: An Introduction with Applications
Statistics
ISBN:
9781119256830
Author:
Amos Gilat
Publisher:
John Wiley & Sons Inc

Probability and Statistics for Engineering and th…
Statistics
ISBN:
9781305251809
Author:
Jay L. Devore
Publisher:
Cengage Learning

Statistics for The Behavioral Sciences (MindTap C…
Statistics
ISBN:
9781305504912
Author:
Frederick J Gravetter, Larry B. Wallnau
Publisher:
Cengage Learning
MATLAB: An Introduction with Applications
Statistics
ISBN:
9781119256830
Author:
Amos Gilat
Publisher:
John Wiley & Sons Inc
Probability and Statistics for Engineering and th…
Statistics
ISBN:
9781305251809
Author:
Jay L. Devore
Publisher:
Cengage Learning
Statistics for The Behavioral Sciences (MindTap C…
Statistics
ISBN:
9781305504912
Author:
Frederick J Gravetter, Larry B. Wallnau
Publisher:
Cengage Learning

Elementary Statistics: Picturing the World (7th E…
Statistics
ISBN:
9780134683416
Author:
Ron Larson, Betsy Farber
Publisher:
PEARSON

The Basic Practice of Statistics
Statistics
ISBN:
9781319042578
Author:
David S. Moore, William I. Notz, Michael A. Fligner
Publisher:
W. H. Freeman

Introduction to the Practice of Statistics
Statistics
ISBN:
9781319013387
Author:
David S. Moore, George P. McCabe, Bruce A. Craig
Publisher:
W. H. Freeman