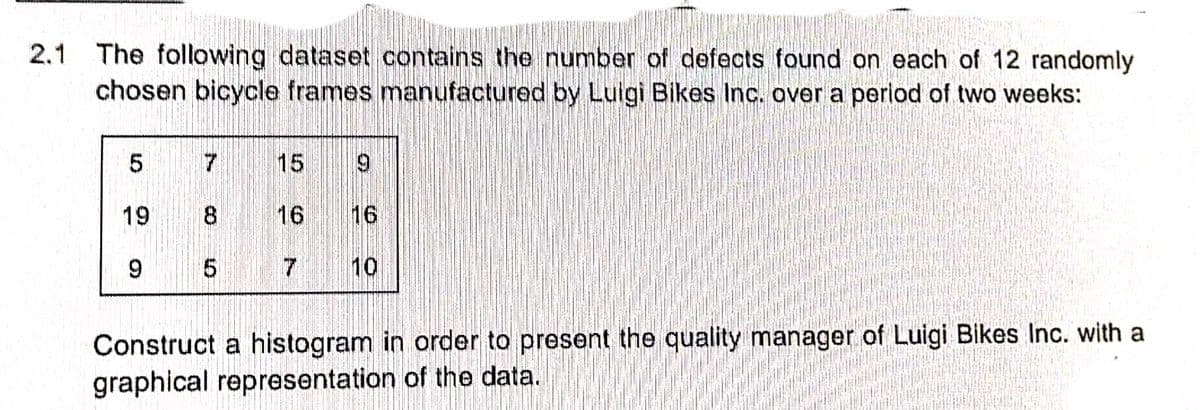
2.1 The following dataset contains the number of defects found on each of 12 randomly chosen bicycle frames manufactured by Luigi Bikes Inc. over a period of two weeks: 5 7 15 9 19 8 16 16 9 5 7 10 Construct a histogram in order to present the quality manager of Luigi Bikes Inc. with a graphical representation of the data.


Q: A) (26.08, 26.32) Q22. The maximum error (the margin of error) of the estimation "E" is: C) 2.34 B)…
A:
Q: 8. mean = 23.8; standard deviation = 5,2
A: Given data : Population Mean,μ = 23.8 Population Standard Deviation,σ = 5.2
Q: Workers at a certain soda drink factory collected data on the volumes (in ounces) of a simple random…
A: Given: Sample size (n) = 22 Sample standard deviation (s) = 0.14 Population standard deviation…
Q: Find the margin of error for the given values of c, s, and n. c= .80 , s=2.2 , n=17
A:
Q: please answer ASAP no excel please. Please show how to solve it. no excel please Provide all…
A: Given: n1 = 27 X1 = 2.33 S1 = 0.54 n2 = 37 X2 = 2.67 S2 = 0.82 Formula Used: Test-statistic t =…
Q: A petroleum engineer estimated the chances of drilling a dry well to be around 50% , and chances of…
A: The probability distribution of the amount of oil and the associated probability of drilling is as…
Q: ********* ******* 15. A split-split plot design has sizes of plots while strip-split plot has - A.…
A: Question 15. In a split-split plot design, there are three plot sizes corresponding to the three…
Q: The Family and Medical Leave Act provides job protection and unpaid time off for full time employees…
A:
Q: researcher is interested to see if having a college degree results in higher incomes. She knows the…
A: Given
Q: Suppose a population has a mean of 400 and a standard deviation of 24. If a random sample of size…
A:
Q: Out of 100 people sampled, 67 preferred Candidate A. Based on this, estimate what proportion of the…
A:
Q: For items 1 to 5: Broadcast duration of episodes of a news show has been observed to be normally…
A:
Q: You may need to use the appropriate appendix table or technology to answer this question. Suppose we…
A: Given Data : Population Mean,μ = 51800 Population Standard Deviation,σ = 4000
Q: Develop a 90% confidence interval estimate for the difference between the proportions of voters…
A:
Q: The values listed below are waiting times (in minutes) of customers at two different banks. At Bank…
A: Given data : A: 6.4,6.6,6.7,6.8,7.1,7.2,7.5,7.9,7.9,7.9 B: 4.2,5.3,5.7,6.1,6.8,7.7,7.7,8.6,9.2,10
Q: arlneDetermine whether the samples are independent or related. 1. A police department wants to…
A: Note: Hi, thank you for the question. As per our company guideline we are supposed to answer only…
Q: For 5 years, Mark was able to save 350,000Php in his savings account. He invested 40% of it in a…
A:
Q: An electronics store sells a particular model of a laptop computer. There are only four laptops in…
A: To find: 1. Mean 2. Variance 3.Standard deviation
Q: accounting firm annually monitors a certain mailing service's performance. One parameter of…
A:
Q: Suppose that 100 lottery tickets are given out in sequence to the first 100 guests to arrive at a…
A: Given : Total number of tickets =100 Winning tickets =12
Q: Use the sample data and confidence level given below to complete parts (a) through (d). A research…
A: Given: n = 995 x = 532 Confidence level = 99 %
Q: Find the 1st quartile, 7th decile, 35th percentile, and percentile rank of 115 and 155 for the…
A:
Q: What is the correlation coefficient with the outlier? rw = What is the correlation coefficient…
A: Correlation coefficient is an associational parametric statistic.
Q: The number of computers sold per day at a local computer store, along with its corresponding…
A: From the above data x P(X) X*P(X) X-µ (X-µ)2 (X-µ)2 *P(X) 0 0.1 0 -2.2 4.84 0.484 1 0.2…
Q: . Given that the distribution of salaries of salesman is not normally distributed. However from past…
A:
Q: Below are the scores of 20 students in a 50-item statistics quiz: 35 42 25 29 38 39 49 41 28 26 26…
A: Given information: No. of…
Q: 7. mean = 60; standard deviation = 6
A: According to policy we supposed to answer first question kindly repost for remaining
Q: Exam-style questions 9 P1: The grouped frequency table below shows the results of a statistics test…
A:
Q: Please also explain why you determined whether or not the results are statistically significant.…
A: Given information isn1=40n2=40s1=0.50
Q: (a) What is the probability a randomly selected student in the city will read more than 96 words per…
A: It is given that Mean, μ = 91 Standard deviation, σ = 10 Sample size, n = 11
Q: matics teachers working in a school want to compare whether there is a difference between the…
A: Given: Teacher A Teacher B 78 83 60 45 51 54 50 44 45 15 40 40 27 71 85
Q: Please also explain why you determined whether or not the results are statistically significant.…
A: It is given that the mean scores for participants in Condition A and Condition B came out exactly…
Q: The data below are yields for two different types of com seed that were used on adjacent plots of…
A: Solution:- from given information μd is the mean value of differences d for the population of all…
Q: An electronics store sells a particular model of a laptop computer. There are only four laptops in…
A:
Q: In an experiment, 18 babies were asked to watch a climber attempt to ascend a hill. On two…
A: Given: n = 18 s = 1.86 Mean difference = 1.06
Q: Q1. A sample of size n = 8 drawn from a normally distributed population has sample mean =14.8 and…
A:
Q: Use Polya’s Four Steps to solve the following problems. (a) Susie’s age this year is a multiple of…
A: Hi! Thank you for the question, As per the honor code, we are allowed to answer one question at a…
Q: 1. Information was collected and summarized in the following table: Head injuries Not injured Wore…
A:
Q: o conduct a test of hypothesis with a single sample mean with N=20, what are the degrees of freedom…
A: As per our guidelines we can solve first multiple-choice question and rest can be reposted.…
Q: correlation is most likely due to coincidence, a common under lying cause, or a direct cause.…
A: "Since you have posted a question with multiple sub-parts, we will solve first three sub-parts for…
Q: A study was conducted to determine the bubble formation of milk as affected by various factors: type…
A:
Q: A survey was given to a random sample of 1750 residents of a town to determine whether they support…
A: Given X=1015 n=1750
Q: According to a study conducted in one city, 35% of adults in the city have credit card debts of…
A:
Q: The following three independent random samples are obtained from three normally distributed…
A: For the given data Perform Anova one way
Q: An insurance agent has claimed that the average age of policyholders who insure through him is less…
A:
Q: Suppose that Xhas a normal distribution, Find E[ekx].
A: Solution
Q: Q1. A sample of size n = 8 drawn from a normally distributed population has sample mean x = 14.8 and…
A:
Q: The chi-square distribution can be used for the following except for?
A: Here use basic of chi - square distribution
Q: Given a population that containing five numbers 2, 3, 6, 8 and 11. If all random samples of size 2…
A: Note: Hi, thank you for the question. As per our company guideline we are supposed to answer first…
Q: You may need to use the appropriate appendix table to answer this question. Suppose that the mean…
A:
A6


Trending now
This is a popular solution!

Step by step
Solved in 2 steps with 1 images

- Recently, researchers have begun to focus on the relationship between potentially toxic environmental exposures in children to a number of adverse health outcomes. Suppose one such researcher wants to investigate the relationship between lead levels in soil (micrograms/dL) and BMI (kg/m2). The following table represents a SRS of households with the corresponding exterior lead levels and BMI of a randomly sampled child in the home. Lead levels BMI 13.6 19.7 14.3 19.9 9.7 20.1 9.4 22.1 11.4 19.8 10.9 21.6 A) Write out the null and alternative hypotheses for a formal test of significance testing the correlation between the two variables and calulate a t statistic and interpret your pvalue and results.The following data are from a random sample of 10 students who participated in a study undertaken to investigate the effect of sleep time (measured in average number of hours of sleep per night) on GPA (grade point average, measured on a 4-point scale). Student Sleep time GPA 1 7 3.28 2 9 3.16 3 8 3.75 4 6 2.50 5 4 2.45 6 8 2.91 7 7 3.53 8 6 3.02 9 3 2.30 10 8 3.48 a. Find the equation between GPA (y) as function of sleep time (x). b. What is the estimated GPA of a student who averages 5 hours of sleep per night? c. What is the coefficient of determination? *(no use EXCEL)A sample of men and women who had passed their driver's test either the first time or the second time were surveyed, with the following results: Results of the driving testGender First time Second timeMen 126 211Women 135 178a) Do these data suggest that there is a relationship between gender and the passing of their driver’s test from which the present sample was drawn? Let alpha=.05
- The following table gives the number of parking tickets obtained in a semester and the GPAs of 77 randomly selected drivers. Number of Tickets 0 1 2 3 4 7 8 GPA 5.5 5 4.5 4 3 2 1.5 Copy Data Determine if r is statistically significant at the 0.010.01 level. Yes or no?A paper investigated the driving behavior of teenagers by observing their vehicles as they left a high school parking lot and then again at a site approximately 1 2 mile from the school. Assume that it is reasonable to regard the teen drivers in this study as representative of the population of teen drivers. Amount by Which Speed Limit Was Exceeded MaleDriver FemaleDriver 1.3 -0.1 1.3 0.4 0.9 1.1 2.1 0.7 0.7 1.1 1.3 1.2 3 0.1 1.3 0.9 0.6 0.5 2.1 0.5 (a) Use a .01 level of significance for any hypothesis tests. Data consistent with summary quantities appearing in the paper are given in the table. The measurements represent the difference between the observed vehicle speed and the posted speed limit (in miles per hour) for a sample of male teenage drivers and a sample of female teenage drivers. (Use μmales − μfemales.Round your test statistic to two decimal places. Round your degrees of freedom down to the nearest whole number. Round your p-value to…A researcher is interested in testing the relationship between smoking and BMI (kg/m2) in adults aged 30-45. In order to test this association, the researcher divides smoking into currently more than a pack a day, currently less than a pack a day, and never smokers. The following table represents the BMIs for each participant enrolled by their respective smoking category. Current Smoker (≥1pack/day) Current Smoker (<1 pack/day Never Smoked 26.7 29.4 22.1 29.4 28.6 30.4 24.3 27.4 21.3 28.4 23.2 26.4 21.6 20.1 19.7 27.4 20.6 19.8 26.8 19.7 21.6 36.4 19.6 22.3 31.5 21.6 24.3 27.4 21.5 *Continue as though all assumptions for ANOVA are met. A) Calculate the MSW and MSB for the data represented above. B) Carry out a formal test for a one-way analysis of variance among the groups and interpret your results.
- A paper investigated the driving behavior of teenagers by observing their vehicles as they left a high school parking lot and then again at a site approximately 1 2 mile from the school. Assume that it is reasonable to regard the teen drivers in this study as representative of the population of teen drivers. Amount by Which Speed Limit Was Exceeded MaleDriver FemaleDriver 1.2 -0.1 1.4 0.4 0.9 1.1 2.1 0.7 0.7 1.1 1.3 1.2 3 0.1 1.3 0.9 0.6 0.5 2.1 0.5 (a) Use a .01 level of significance for any hypothesis tests. Data consistent with summary quantities appearing in the paper are given in the table. The measurements represent the difference between the observed vehicle speed and the posted speed limit (in miles per hour) for a sample of male teenage drivers and a sample of female teenage drivers. (Use μmales − μfemales.Round your test statistic to two decimal places. Round your degrees of freedom down to the nearest whole number. Round your p-value to…In ongoing economic analyses, the U.S. federal government compares per capita incomes not only among different states but also for the same state at different times. Typically, what the federal government finds is that "poor" states tend to stay poor and "wealthy" states tend to stay wealthy. Would we have been able to predict the 1999 per capita income for a state (denoted by y ) from its 1980 per capita income (denoted by x )? The following bivariate data give the per capita income (in thousands of dollars) for a sample of fourteen states in the years 1980 and 1999 (source: U.S. Bureau of Economic Analysis, Survey of Current Business, May 2000 ). The data are plotted in the scatter plot in Figure 1, and the least-squares regression line is drawn. The equation for this line is =y+0.382.75x . 1980 per capita income, x(in $1000s) 1999 per capita income, y(in $1000s) South Dakota 8.1 25.1 Utah 8.5 23.4 West Virginia 8.2 20.9…andres asked if there is a relationship between the quality of sneakers worn by a sample of 20 volleyball players and their average number of point scored per game. he computed r= +.21 and immediately claimed he had evidence that better-quality sneakers are related to better performance (a) is his claim correct? why? (b) what are Ho and Ha? (c) with alpha=.05, what is rcrit ?
- MR In Dave Eggers’ novel The Circle, a mysteri-ous technology company has developed a strangely data-driven work environment in which employees are assigned a performance score that seems to be the product of factors in their social activities and environment, such as the extent of their engagement in work community and the number of times they post on the company’s social media site. Using the fictional data below, compute r and r2 for each com-bination of two variables from this novel and test the correlations for their significance. Write a paragraph interpreting the relationships between these vari-ables, and what they might mean for the companyAirline passengers were asked two questions: #1, In the past year, when traveling for business, what type of ticket did you purchase most often?", and #2, "Was the flight domestic or international?" THe following table presents the results: "Type of Ticket?" "Domestic" "International" "First Class" 29 22 "Business Class" 95 121 "Economy Class" 518 135 If a Test of Independence will be performed on this dataset, with alpha = 0.10, state the value of the Critical Number that you'd use to set up the Rejection Region for this test. The value of the Critical Number to be used in this Test of Independence is:A Canadian study measuring depression level in teens (as reported in the Journal of Adolescence, vol. 25, 2002) randomly sampled 112 male teens and 101 female teens, and scored them on a common depression scale (higher score representing more depression). The researchers suspected that the mean depression score for male teens is higher than for female teens, and wanted to check whether data would support this hypothesis. If μ1 and μ2 represent the mean depression score for male teens and female teens respectively, which of the following is an appropriate pair of hypotheses in this case? Check all that apply.