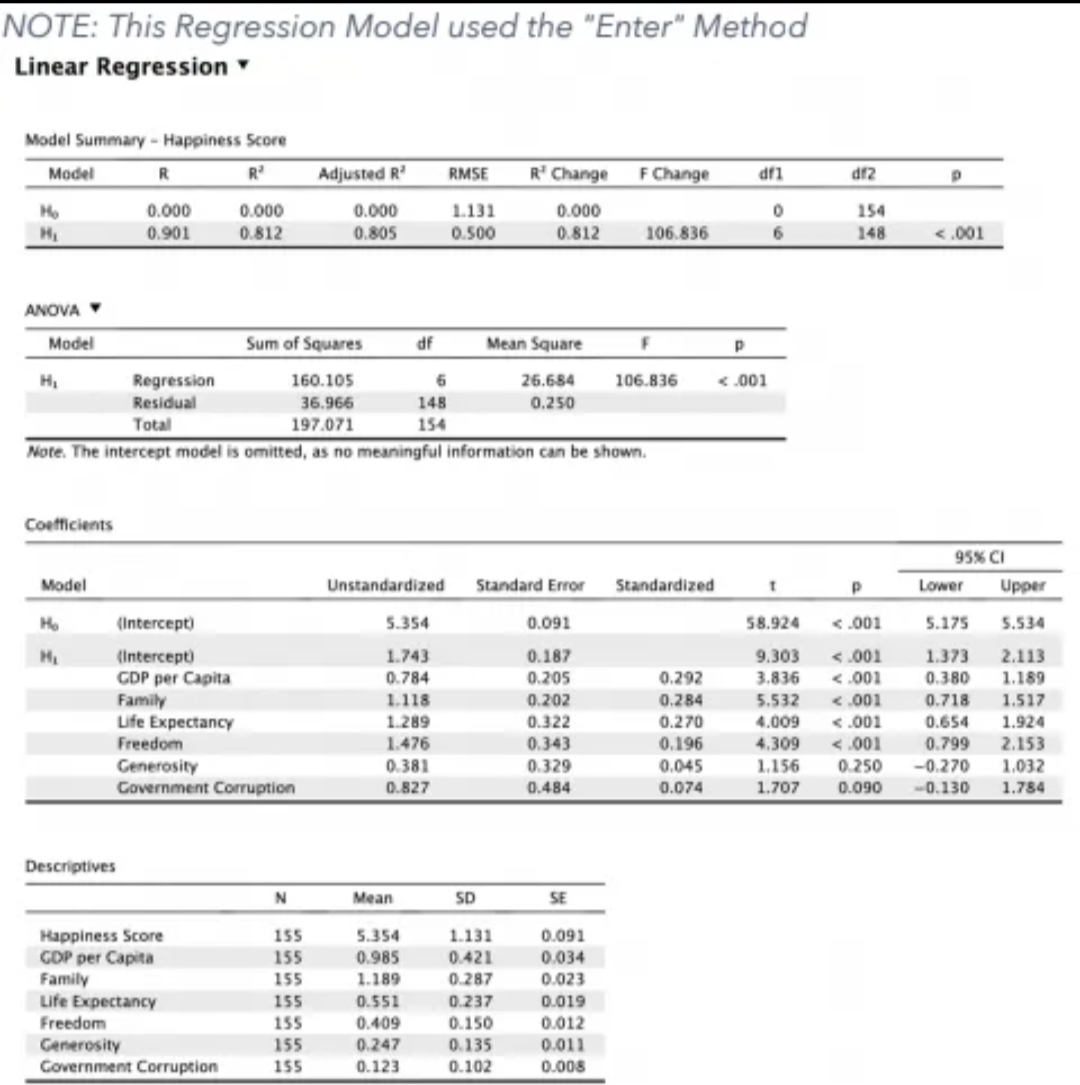
After careful consideration of the single factor identified in the model above, the researchers were interested in compounding more factors that influence the country's level of happiness. The added factors were GDP Per Capita, Family, Life Expectance, Generosity and Government Corruption. A. Using the results found below, provide a Table-Reading Texts to each set of results. B. What happened to the main variable which is Freedom when other variables were added to the regression test? What is the implication to this in the context of approximating the reality of "happiness" across countries which is happiness?
After careful consideration of the single factor identified in the model above, the researchers were interested in compounding more factors that influence the country's level of happiness. The added factors were GDP Per Capita, Family, Life Expectance, Generosity and Government Corruption. A. Using the results found below, provide a Table-Reading Texts to each set of results. B. What happened to the main variable which is Freedom when other variables were added to the regression test? What is the implication to this in the context of approximating the reality of "happiness" across countries which is happiness?
Managerial Economics: Applications, Strategies and Tactics (MindTap Course List)
14th Edition
ISBN:9781305506381
Author:James R. McGuigan, R. Charles Moyer, Frederick H.deB. Harris
Publisher:James R. McGuigan, R. Charles Moyer, Frederick H.deB. Harris
Chapter4: Estimating Demand
Section: Chapter Questions
Problem 1E
Related questions
Question

Transcribed Image Text:5. After careful consideration of the single factor identified in the model above, the
researchers were interested in compounding more factors that influence the country's
level of happiness. The added factors were GDP Per Capita, Family, Life Expectance,
Generosity and Government Corruption.
A. Using the results found below, provide a Table-Reading Texts to each set of
results.
B. What happened to the main variable which is Freedom when other variables were
added to the regression test? What is the implication to this in the context of
approximating the reality of "happiness" across countries which is happiness?

Transcribed Image Text:NOTE: This Regression Model used the "Enter" Method
Linear Regression ▾
Model Summary - Happiness Score
Model
R
R²
Ho
ANOVA
Model
H₂
Coefficients
Model
Ho
0.000
0.901
Descriptives
Regression
Residual
Total
(Intercept)
(Intercept)
GDP per Capita
Family
Life Expectancy
0.000
0.812
Sum of Squares
160.105
36.966
197.071
Note. The intercept model is omitted, as no meaningful information can be shown.
Freedom
Generosity
Government Corruption
Happiness Score
GDP per Capita
Family
Life Expectancy
Freedom
Generosity
Government Corruption
N
Adjusted R²
155
155
155
155
155
155
155
0.000
0.805
df
5.354
1.743
0.784
1.118
1.289
1.476
Mean
Unstandardized Standard Error
0.381
0.827
5.354
0.985
1.189
6
148
154
0.551
0.409
RMSE
1.131
0.500
0.247
0.123
R¹ Change
0.000
0.812
Mean Square
26.684
0.250
SD
1.131
0.421
0.287
0.237
0.150
0.135
0.102
0.091
0.187
0.205
0.202
0.322
0.343
0.329
0.484
F Change
SE
0.091
0.034
0.023
0.019
0.012
0.011
0.008
106.836
F
106.836
Standardized
0.292
0.284
0.270
0.196
0.045
0.074
P
df1
0
6
<.001
T
df2
1.156
1.707
154
148
P
58.924
<.001
9.303 <.001
3.836 <.001
5.532 < .001
4.009
<.001
4.309 <.001
p
<.001
95% CI
Lower
Upper
5.534
2.113
1.189
5.175
1.373
0.380
0.718
1.517
0.654 1.924
0.799
2.153
1.032
1.784
0.250 -0.270
0.090 -0.130
Expert Solution
This question has been solved!
Explore an expertly crafted, step-by-step solution for a thorough understanding of key concepts.
Step by step
Solved in 2 steps with 1 images

Knowledge Booster
Learn more about
Need a deep-dive on the concept behind this application? Look no further. Learn more about this topic, economics and related others by exploring similar questions and additional content below.Recommended textbooks for you

Managerial Economics: Applications, Strategies an…
Economics
ISBN:
9781305506381
Author:
James R. McGuigan, R. Charles Moyer, Frederick H.deB. Harris
Publisher:
Cengage Learning

Managerial Economics: Applications, Strategies an…
Economics
ISBN:
9781305506381
Author:
James R. McGuigan, R. Charles Moyer, Frederick H.deB. Harris
Publisher:
Cengage Learning