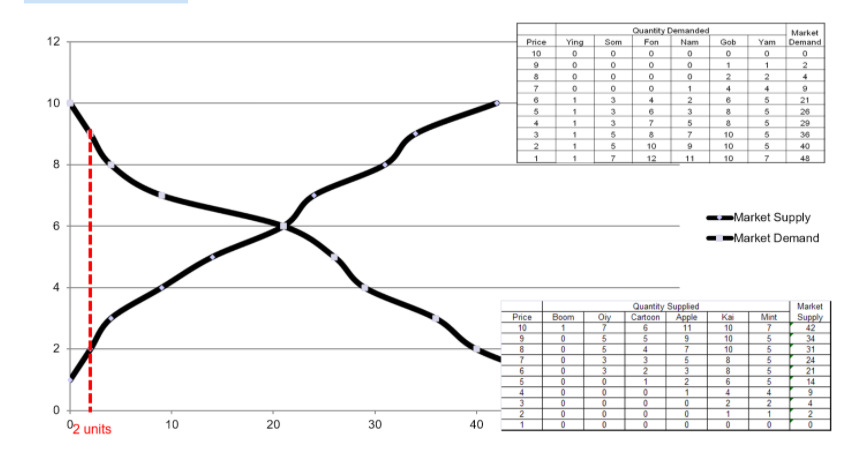
A Gain from Trade occurs when a unit is sold for a price greater than the unit of the good is worth to a seller and, simultaneously, bought for a price less than the good is worth to a buyer. Consider the first 2 units of the good that would be sold in this market (the vertical red line on the graph). which answer choices are correct for the graph given bellow?
A Gain from Trade occurs when a unit is sold for a price greater than the unit of the good is worth to a seller and, simultaneously, bought for a price less than the good is worth to a buyer. Consider the first 2 units of the good that would be sold in this market (the vertical red line on the graph). which answer choices are correct for the graph given bellow?

Principles of Economics 2e
2nd Edition
ISBN:9781947172364
Author:Steven A. Greenlaw; David Shapiro
Publisher:Steven A. Greenlaw; David Shapiro
Chapter12: Environmental Protection And Negative Externalities
Section: Chapter Questions
Problem 14RQ: What is an externality?

Related questions
Question
A
Consider the first 2 units of the good that would be sold in this market (the vertical red line on the graph).
which answer choices are correct for the graph given bellow?
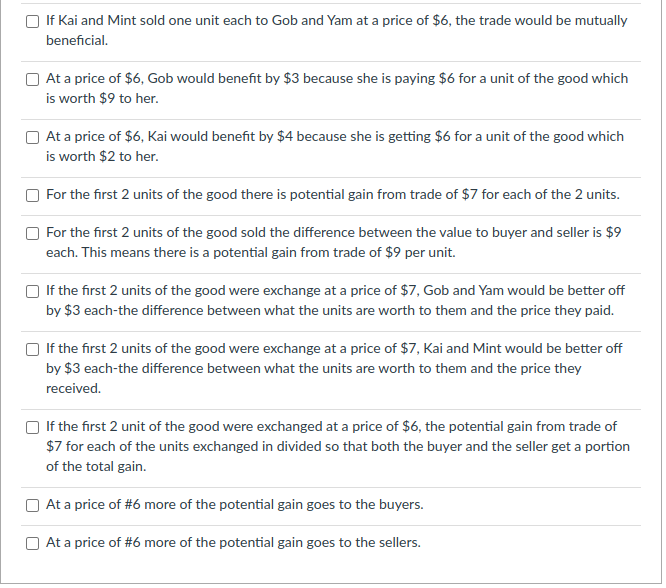
Transcribed Image Text:If Kai and Mint sold one unit each to Gob and Yam at a price of $6, the trade would be mutually
beneficial.
At a price of $6, Gob would benefit by $3 because she is paying $6 for a unit of the good which
is worth $9 to her.
At a price of $6, Kai would benefit by $4 because she is getting $6 for a unit of the good which
is worth $2 to her.
For the first 2 units of the good there is potential gain from trade of $7 for each of the 2 units.
For the first 2 units of the good sold the difference between the value to buyer and seller is $9
each. This means there is a potential gain from trade of $9 per unit.
If the first 2 units of the good were exchange at a price of $7, Gob and Yam would be better off
by $3 each-the difference between what the units are worth to them and the price they paid.
If the first 2 units of the good were exchange at a price of $7, Kai and Mint would be better off
by $3 each-the difference between what the units are worth to them and the price they
received.
If the first 2 unit of the good were exchanged at a price of $6, the potential gain from trade of
$7 for each of the units exchanged in divided so that both the buyer and the seller get a portion
of the total gain.
At a price of #6 more of the potential gain goes to the buyers.
At a price of #6 more of the potential gain goes to the sellers.
Transcribed Image Text:Ouantity Demanded
12
Market
Demand
Price
Ying
Som
Fon
Nam
Gob
Yam
10
1.
2
4
4
10
4.
21
5
26
3
7
29
3
10
5
36
5
10
10
40
1
7
12
11
10
48
1
Market Supply
6
-Market Demand
Quantity Supplied
Market
Price
Boom
1
Oly
Cartoon
Mint
Supply
42
34
31
24
21
Apple
Kai
10
10
6
11
10
10
8
4
3
3
3
5
3
2
5
14
4
9
4
1
2
02 units
10
20
30
40
의의으
Expert Solution
This question has been solved!
Explore an expertly crafted, step-by-step solution for a thorough understanding of key concepts.

This is a popular solution!

Trending now
This is a popular solution!

Step by step
Solved in 3 steps

Knowledge Booster


Learn more about
Need a deep-dive on the concept behind this application? Look no further. Learn more about this topic, economics and related others by exploring similar questions and additional content below.Recommended textbooks for you
Principles of Economics 2e
Economics
ISBN:
9781947172364
Author:
Steven A. Greenlaw; David Shapiro
Publisher:
OpenStax
Principles of Economics 2e
Economics
ISBN:
9781947172364
Author:
Steven A. Greenlaw; David Shapiro
Publisher:
OpenStax