Ages 15-18 Number of students 7 19-22 23-26 27-30 31-34 9. 35-38 Based on the frequency distribution above, find the cumulative frequency for the class with lower class limit 27 Cumulative Frequency = Give your answer rounded to one decimal place
Ages 15-18 Number of students 7 19-22 23-26 27-30 31-34 9. 35-38 Based on the frequency distribution above, find the cumulative frequency for the class with lower class limit 27 Cumulative Frequency = Give your answer rounded to one decimal place

Functions and Change: A Modeling Approach to College Algebra (MindTap Course List)
6th Edition
ISBN:9781337111348
Author:Bruce Crauder, Benny Evans, Alan Noell
Publisher:Bruce Crauder, Benny Evans, Alan Noell
Chapter2: Graphical And Tabular Analysis
Section2.3: Solving Linear Equations
Problem 27E

Related questions
Question
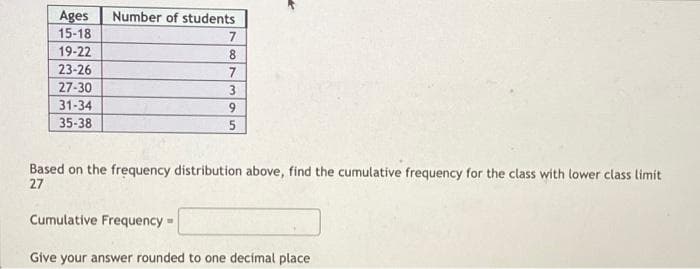
Transcribed Image Text:Ages
15-18
Number of students
7.
19-22
8
23-26
27-30
31-34
9.
35-38
Based on the frequency distribution above, find the cumulative frequency for the class with lower class limit
27
Cumulative Frequency -
Give your answer rounded to one decimal place
Expert Solution
This question has been solved!
Explore an expertly crafted, step-by-step solution for a thorough understanding of key concepts.

This is a popular solution!

Trending now
This is a popular solution!

Step by step
Solved in 2 steps with 2 images

Recommended textbooks for you
Functions and Change: A Modeling Approach to Coll…
Algebra
ISBN:
9781337111348
Author:
Bruce Crauder, Benny Evans, Alan Noell
Publisher:
Cengage Learning

Big Ideas Math A Bridge To Success Algebra 1: Stu…
Algebra
ISBN:
9781680331141
Author:
HOUGHTON MIFFLIN HARCOURT
Publisher:
Houghton Mifflin Harcourt
Functions and Change: A Modeling Approach to Coll…
Algebra
ISBN:
9781337111348
Author:
Bruce Crauder, Benny Evans, Alan Noell
Publisher:
Cengage Learning
Big Ideas Math A Bridge To Success Algebra 1: Stu…
Algebra
ISBN:
9781680331141
Author:
HOUGHTON MIFFLIN HARCOURT
Publisher:
Houghton Mifflin Harcourt