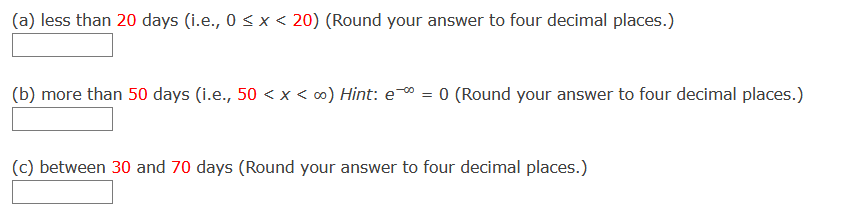
(a) less than 20 days (i.e., 0 < x < 20) (R (b) more than 50 days (i.e., 50 < x < ∞) / (c) between 30 and 70 days (Round your a


Continuous Probability Distributions
Probability distributions are of two types, which are continuous probability distributions and discrete probability distributions. A continuous probability distribution contains an infinite number of values. For example, if time is infinite: you could count from 0 to a trillion seconds, billion seconds, so on indefinitely. A discrete probability distribution consists of only a countable set of possible values.
Normal Distribution
Suppose we had to design a bathroom weighing scale, how would we decide what should be the range of the weighing machine? Would we take the highest recorded human weight in history and use that as the upper limit for our weighing scale? This may not be a great idea as the sensitivity of the scale would get reduced if the range is too large. At the same time, if we keep the upper limit too low, it may not be usable for a large percentage of the population!
The Poisson distribution gives the probability for the number of occurrences for a "rare" event. Now, let x be a random variable that represents the waiting time between rare events. Using some mathematics, it can be shown that x has an exponential distribution. Let x > 0 be a random variable and let ? > 0 be a constant. Then y = 1/B e^-x/b is a curve representing the exponential distribution. Areas under this curve give us exponential (refer to screenshot)
(a) less than 20 days (i.e., 0 ≤ x < 20) (Round your answer to four decimal places.)
(b) more than 50 days
![The Poisson distribution gives the probability for the number of occurrences for a "rare" event. Now, let x be a random variable that represents the waiting time between rare events. Using some mathematics, it can be
shown that x has an exponential distribution. Let x > 0 be a random variable and let ß > 0 be a constant. Then y = ex/B is a curve representing the exponential distribution. Areas under this curve give us exponential
probabilities.
y
a
If a and b are any numbers such that 0 < a < b, then using some extra mathematics, it can be shown that the area under the curve above the interval [a, b] is the following.
P(a < x < b) = e¯a/ß - e-b/ß
Notice that by definition, x cannot be negative, so, P(x < 0) = 0. The random variable x is called an exponential random variable. Using some more mathematics, it can be shown that the mean and standard deviation of x
are the following.
µ = B and o = ß
Note: The number e = 2.71828. .. is used throughout probability, statistics, and mathematics. The key eš is conveniently located on most calculators.
Comment: The Poisson and exponential distributions have a special relationship. Specifically, it can be shown that the waiting time between successive Poisson arrivals (i.e., successes or rare events) has an exponential
distribution with B = 1/2, where 2 is the average number of Poisson successes (rare events) per unit of time.
Fatal accidents on scheduled domestic passenger flights are rare events. In fact, airlines do all they possibly can to prevent such accidents. However, around the world such fatal accidents do occur. Let x be a random
variable representing the waiting time between fatal airline accidents. Research has shown that x has an exponential distribution with a mean of approximately 44 days.t
We take the point of view that x (measured in days as units) is a continuous random variable. Suppose a fatal airline accident has just been reported on the news. What is the probability that the waiting time to the next
reported fatal airline accident is the following?](/v2/_next/image?url=https%3A%2F%2Fcontent.bartleby.com%2Fqna-images%2Fquestion%2Fc01a9961-f4af-4936-9d1a-73a794ae51dd%2F4ec8f367-d33d-4808-8cf7-ec3be5bd2c21%2Fyvt7kab_processed.png&w=3840&q=75)


Trending now
This is a popular solution!

Step by step
Solved in 2 steps with 2 images


