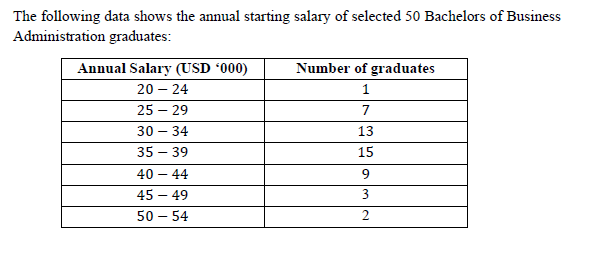
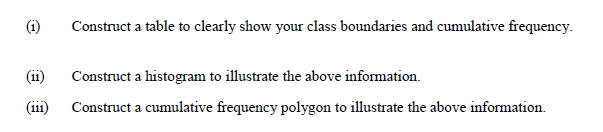
(i) Construct a table to clearly show your class boundaries and cumulative frequency. (ii) Construct a histogram to illustrate the above information. (i) Construct a cumulative frequency polygon to illustrate the above information.


Q: Use the table to find the probabilities for a juice chosen from the shelf at random. P(less than 40...
A:
Q: Suppose the reaction temperature X (in °C) in a certain chemical process has a uniform distribution ...
A:
Q: 3. ABC hospital with branches in lloilo City and in Bacolod City has developed an improved process f...
A: Let μ1 be the average waiting time lliolo city μ2 be the average waiting time Bacolod city Note: ...
Q: (a) A daily sample of 30 items was taken over a period of 14 days in order to establish control limi...
A:
Q: Job satisfaction: In a poll, 422 out of 1611 people said that their main satisfaction in life comes ...
A: a) According to the poll, 422 out of 1611 people said that their main satisfaction in life comes fro...
Q: Get an education: A survey asked 32,145 people how much confidence they had in educational Instituti...
A: The probability would be unusual if it is less than 0.05
Q: If a die is rolled one time, what is the probabilities of each outcome: a. getting a number greater...
A: GivenA die is rolled one timethen the outcomes are{1,2,3,4,5,6}Total no.of outcomes = 6
Q: An internet company conducts a global consumer survey to help multinational companies understand dif...
A:
Q: Q5. Which is a 90% C.I.? A. X+ 19E B. X+ 164 c. X4 225, D. X+ 175 A. X± 1.99, В. Х+1.64 D. X+ 1.75 О...
A:
Q: Is the z-score z = -1.05 to the left or to the right of the mean?
A: In the given problem, z-score is –1.05.
Q: The following frequency distribution shows the number of crimes committed in a sample of 100 urban n...
A: Number pf crimes Neighborhoods frequency (f) 0-9 10 10-19 20 20-29 30 30-39 30 40-49 10 ...
Q: Which of the following is(are) TRUE?
A: The board will approve the procedure if the clinical trials show that it would cure at least 60% of ...
Q: Cynthia is planning a party. For entertainment, she has designed a game that involves spinning two s...
A:
Q: Researchers studying the acquisition of pronunciati on often compare measurements made on the record...
A: Given that researchers studying the acquisition of pronunciation often compare measurements made on ...
Q: Answer the following statistic questions. What is the difference between sigma (o) and s? What needs...
A: Sigma represents populations standard deviation derived from a infinite number of measurements, wher...
Q: Write each product in the form nPn: a) (6)(5)(4)(3)(2)(1) =
A: Given that (6)(5)(4)(3)(2)(1) We have to write above in the form of permutation as nPn
Q: For the data set 1 2 3 57 7 8 9 10 12 13 13 14 14 15 16 16 19 19 21 23 23 23 24 26 26 27 27 28 28 31...
A: Given data set 1,2,3,5,7,7,8,9,10,12,13,13,14,14,15,16,16,19,19,21,23,23,23,24,26,26,27,27,28,28,31,...
Q: Example 42. The mean and standard deviation of 20 items was found Later, it was found that item 12 w...
A:
Q: What is the critical value t* for a 90% confidence interval when n = 15? 1.645 O b 1.960 1.761
A: Given: n = 15 confidence level, c = 90% = 0.90
Q: Votes for Candidate A Votes for Number of Electoral Number of Electoral Votes for B State Candidate ...
A:
Q: Example 2.24 In a city, suppose that only 60% of the people read a newspaper. What is the probabilit...
A:
Q: 2. A scrap metal dealer claims that the mean of his cash sales is "no more than $80," but an Interna...
A: Given that: Population mean(u) = $ 80 Sample mean = $ 91 SAMPLE standard deviation = $21 Sample size...
Q: 6) Which of the following is true about the relationship between the confidence level and the margin...
A:
Q: Take a guess: A student takes a multiple-choice test that has 11 questions. Each question has five c...
A: Givenn=11p=15q=1-pq=1-15=45A random variable X~Bionomial(n=11 , p=15)P(X=x)=11x15x4511-x ; x=0,1,...
Q: The weights of new born black bear cubs are uniformly distributed with minimum of 245 and maximum of...
A:
Q: Use the ALEKS calculator to solve the following problems. (a) Consider at distribution with 30 degre...
A: Given : Degree of freedom, df = 30
Q: When applying one-way analysis of variance (ANOVA), all the following are key assumptions that shoul...
A: Solution.
Q: Does room temperature affect cognitive function A psychologist randomly divides 60 volunteers into t...
A: Note: According to Bartleby expert guidelines, we can answer only first question with their three su...
Q: Insurance: An insurance company sells a 1-year term life insurance policy to an 85-year-old woman. T...
A:
Q: Example 2.17 Let X be a continuous type random variable with PDF given as f(x) = 27 Let Y be another...
A:
Q: How many kids? In a survey 46,200 women were asked how many children they had. The results were as f...
A:
Q: 7. The Yupi Diliman Chancellor wants to know the current condition of the laboratory rooms in the ca...
A: Here, our objective is to determine the total number of laboratory rooms in need of repair. Ten buil...
Q: An agricultural researcher plants 50 plots with a new variety of potatoes. A 90% confidence interval...
A:
Q: In the Standard Normal distribution of Z, Z ~ N(0,1), find the Z value Zo.025 such that Pr(Z<Zo.025)...
A: Given that Z follows standard normal distribution with mean =zero and standard deviation =1 Z~N(μ= ...
Q: 1 Given the probability density function f(x) = 4 over the interval [1, 5], find the expected value,...
A:
Q: O = Let 0, X,, X2,... be RVs. Suppose that, conditional on 0, X1, X2,... are independent and X, is n...
A:
Q: Suppose you are incharge of rationing in a State affected by food shortage. The following reports ar...
A:
Q: Rahmat Pasta Sdn. Bhd. is a company that specializes in producing healthy pasta for kids in Malaysia...
A: Question: Let us first formulate the equations Let x,y,z be the number of boxes of Simple Dimple Pas...
Q: The following information was obtained from independent random samples. Assume Normally distributed ...
A:
Q: Using a cutoff of 0.05, is it unusual for an asthma patient to be 85 years old or older?
A: It is given that Total = 409743 Number of asthma patient 85 and up = 16768
Q: In any two series, where d¡ and d, represent the deviation from a trial average, 100. N = 150 N2 = 2...
A:
Q: Match the correct critical values for the t, and chi-square and tolerance interval factor - v x2 0.0...
A: as per our company guidelines we are supposed to answer only first 3 sub-parts. Kindly repost other ...
Q: [mor- ]× ]" 10 (y) dy = + y 2
A: here given pdf of total waiting time y
Q: Suppose that X has a lognormal distribution with parameters θ = 5 and ω2 = 9. Determine the followin...
A: Solution-: We have X has a lognormal distribution with parameter θ=5 and ω2=9 Therefore, ω=3 We find...
Q: development of Process Flow Diagram? Is it necessary for industrial engineers to know the creation o...
A: Flowchart: When designing and planning a process, flowcharts can help you identify its essential st...
Q: Mathematical Journal When do you use these formulae? z=
A:
Q: Q1. The random variable X has an unknown mean but known variance of 8 i.e. X~N (μ, 8). A random samp...
A: Given X~N(μ,σ2=16), n=16, x̄=7, sample variance=S2=11
Q: How many different sets of three candies can you select?
A: A candy jar has 10 different candies in it three candies are selected from jar
Q: A. Ho: На: B. What is the level of significance? C. Type of Test
A: Here AS PER POLICY I HAVE CALCULATED FIRST 3 SUBPART PLZ REPOST FOR REMAINING PARTS
Q: lustration 40. Given that: N= 10, Total Variation = E(Y-Y² = 38.92 and Unexplained variation = 2(Y-Y...
A:

Step by step
Solved in 3 steps with 2 images

- A survey of 400400 volunteers yielded the following information: 265265 were tour guides, 215215 were retirees, and 150150 of the tour guides were retirees. How many of the 400400 surveyed volunteers were tour guides or were retirees?The personnel department of a large corporation reported 60 resignations during the last year. The following table groups these resignations according to the season in which they occur. Carry out a test to determine if the number of resignations is uniform over the four seasons.Calculate the point prevalence for Alzheimer’s disease among individuals 65 years of age or older in a county that has 200,000 individuals who are 65 years of age or older, if 22,223 individuals who are 65 years of age or older have the disease. 0.0111 0.1111 0.8889 0.9889
- The management of the local zoo wants to know if all of their animal exhibits are equally popular. If there is significant evidence that some of the exhibits are not being visited frequently enough, then changes may need to take place within the zoo. A tally of visitors is taken for each of the following animals throughout the course of a week, and the results are contained in the following table. At α=0.005, determine whether there is sufficient evidence to conclude that some exhibits are less popular than others. Animal Exhibits at the Zoo Elephants Lions/Tigers Giraffes Zebras Monkeys Birds ReptilesNumber of visitors 152 175 185 144 145 171 163 Step 2 of 4 : Calculate the expected value for the number of visitors for the birds exhibit. Enter your answer as a fraction or a decimal rounded to three decimal places. Step 3 of 4: Compute the value of the test statistic. Round any calculations to at least six decimals places and round your final answer to three…Assume that a researcher randomly selects the 15 newborn babies and counts the number of girls,d.The management of the local zoo wants to know if all of their animal exhibits are equally popular. If there is significant evidence that some of the exhibits are not being visited frequently enough, then changes may need to take place within the zoo. A tally of visitors is taken for each of the following animals throughout the course of a week, and the results are contained in the following table. At α=0.05, determine whether there is sufficient evidence to conclude that some exhibits are less popular than others. Animal Exhibits at the ZooElephants Lions/Tigers Giraffes Zebras Monkeys Birds ReptilesNumber of visitors 137 129 161 147 160 134 131 Step 3 of 4 : Compute the value of the test statistic. Round any intermediate calculations to at least six decimal places, and round your final answer to three decimal places. Step 4 of 4: Draw a conclusion and interpret the decision. (Reject or fail to reject, Is there enough evidence or not?)
- The management of the local zoo wants to know if all of their animal exhibits are equally popular. If there is significant evidence that some of the exhibits are not being visited frequently enough, then changes may need to take place within the zoo. A tally of visitors is taken for each of the following animals throughout the course of a week, and the results are contained in the following table. At α=0.05, determine whether there is sufficient evidence to conclude that some exhibits are less popular than others. Animal Exhibits at the Zoo Elephants Lions/Tigers Giraffes Zebras Monkeys Birds Reptiles Number of visitors 139 136 169 125 174 137 174 Copy Data Step 3 of 4 : Compute the value of the test statistic. Round any intermediate calculations to at least six decimal places, and round your final answer to three decimal places.A survey of 600600 volunteers yielded the following information: 401401 were tour guides, 325325 were retirees, and 230230 of the tour guides were retirees. How many volunteers were tour guides but were not retirees?To receive a C grade, a student must average more than 7777 but less than or equal to 8585. If Noah received a C in the course and had five grades of 7373, 8585, 7373, 6969, and 7878 before taking the final exam, what were the possible grades for his final if there were 100100 points possible? (Assume all six grades are weighted equally and let x represent the unknown score.)
- A fleet of 100 taxis is divided into two groups of 50 cars each to see whether premium gasoline reduces maintenance costs. Premium unleaded fuel is used in group A, while regular unleaded fuel is used in group B. The total maintenance cost for each vehicle during a one-year period is recorded. Premium fuel will be used if it is shown to reduce maintenance costs.The accompanying table shows the data for the top 10 passers in a certain year. In the regular season, a certain player attempted 548 passes, completed 320, passed for 16 touchdowns, gained 3780 yards passing, and was intercepted 28 times. With no interceptions, would this played have risen into the top ten rankings?A new drug to treat psoriasis has been developed and is in clinical testing. Assume that those individuals given the drug are examined before receiving the treatment and then again after receiving the treatment to determine if there was a change in their symptom status. If the initial results showed that 2.0% of individuals entered the study in remission, 77.0% of individuals entered the study with mild symptoms, 16.0% of individuals entered the study with moderate symptoms, and 5.0% entered the study with severe symptoms calculate and interpret a chi-squared test to determine if the drug was effective treating psoriasis given the information below from the final examination. Remission (No Symptoms of Psoriasis) Mild Symptoms of Psoriasis Moderate Symptoms of Psoriasis Severe Symptoms of Psoriasis Total Number of Participants to Receive the Drug Number of Participants 380 520 95 5 1000 A) We reject H0 because 6628.075 is greater than 5.99. We have…