E 19. In exercise 7 a sales manager collected the following data on x = annual sales and y = years of experience. The estimated regression equation for these data is ŷ = 80 + 4x. Houps Annual Sales Salesperson Years of Experience ($1000s) 1 80 3 97 4 92 4 102 103 111 10 119 10 123 11 117 13 136 a. Compute SST, SSR, and SSE. b. Compute the coefficient of determination r². Comment on the goodness of fit. What is the value of the sample correlation coefficient? C. 1234567890
E 19. In exercise 7 a sales manager collected the following data on x = annual sales and y = years of experience. The estimated regression equation for these data is ŷ = 80 + 4x. Houps Annual Sales Salesperson Years of Experience ($1000s) 1 80 3 97 4 92 4 102 103 111 10 119 10 123 11 117 13 136 a. Compute SST, SSR, and SSE. b. Compute the coefficient of determination r². Comment on the goodness of fit. What is the value of the sample correlation coefficient? C. 1234567890

Functions and Change: A Modeling Approach to College Algebra (MindTap Course List)
6th Edition
ISBN:9781337111348
Author:Bruce Crauder, Benny Evans, Alan Noell
Publisher:Bruce Crauder, Benny Evans, Alan Noell
Chapter5: A Survey Of Other Common Functions
Section5.6: Higher-degree Polynomials And Rational Functions
Problem 1TU: The following fictitious table shows kryptonite price, in dollar per gram, t years after 2006. t=...

Related questions
Question
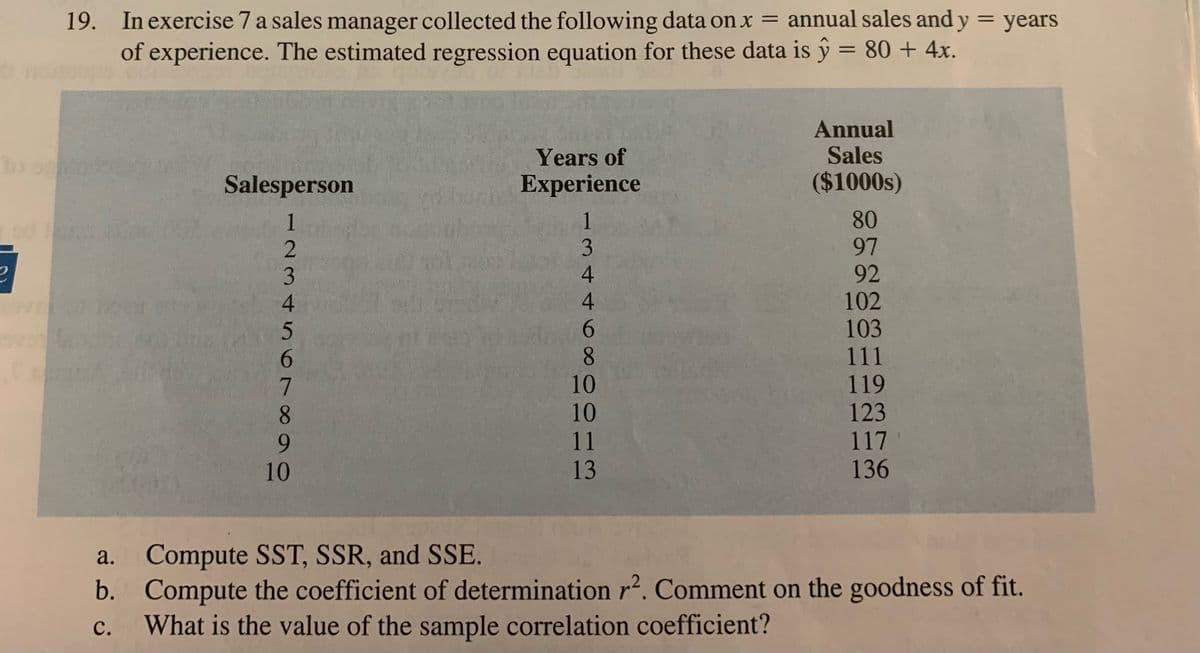
Transcribed Image Text:19. In exercise 7 a sales manager collected the following data on x = annual sales and y = years
of experience. The estimated regression equation for these data is ŷ = 80 + 4x.
Annual
Sales
to ogn'in
Years of
Experience
Salesperson
($1000s)
1
1
80
3
97
ē
4
92
4
102
103
111
r
10
119
10
123
11
117
13
136
a.
Compute SST, SSR, and SSE.
b.
Compute the coefficient of determination r². Comment on the goodness of fit.
What is the value of the sample correlation coefficient?
C.
Ö6%B9CAWN
5000+
10
Expert Solution
This question has been solved!
Explore an expertly crafted, step-by-step solution for a thorough understanding of key concepts.

This is a popular solution!

Trending now
This is a popular solution!

Step by step
Solved in 2 steps with 2 images

Recommended textbooks for you
Functions and Change: A Modeling Approach to Coll…
Algebra
ISBN:
9781337111348
Author:
Bruce Crauder, Benny Evans, Alan Noell
Publisher:
Cengage Learning

Algebra & Trigonometry with Analytic Geometry
Algebra
ISBN:
9781133382119
Author:
Swokowski
Publisher:
Cengage

College Algebra
Algebra
ISBN:
9781305115545
Author:
James Stewart, Lothar Redlin, Saleem Watson
Publisher:
Cengage Learning
Functions and Change: A Modeling Approach to Coll…
Algebra
ISBN:
9781337111348
Author:
Bruce Crauder, Benny Evans, Alan Noell
Publisher:
Cengage Learning
Algebra & Trigonometry with Analytic Geometry
Algebra
ISBN:
9781133382119
Author:
Swokowski
Publisher:
Cengage
College Algebra
Algebra
ISBN:
9781305115545
Author:
James Stewart, Lothar Redlin, Saleem Watson
Publisher:
Cengage Learning

Algebra and Trigonometry (MindTap Course List)
Algebra
ISBN:
9781305071742
Author:
James Stewart, Lothar Redlin, Saleem Watson
Publisher:
Cengage Learning