Wage rate $16 15 14 S 0 80 100 110 Reference: Ref8(23)-10 Figure: The Labor Market 200 Quantity of labor (in thousands) (Figure: The Labor Market) Use Figure: The Labor Market. The equilibrium wage rate is: A. $14. B. $16. C. $15. D. $17. Aggregate Expenditure ($) 3 Real GDP (Y) Which of the lines represents the C + I stacked functions? line 1 line 2 line 3 line 4 line 3 line 2 line 1
Wage rate $16 15 14 S 0 80 100 110 Reference: Ref8(23)-10 Figure: The Labor Market 200 Quantity of labor (in thousands) (Figure: The Labor Market) Use Figure: The Labor Market. The equilibrium wage rate is: A. $14. B. $16. C. $15. D. $17. Aggregate Expenditure ($) 3 Real GDP (Y) Which of the lines represents the C + I stacked functions? line 1 line 2 line 3 line 4 line 3 line 2 line 1

Survey of Economics (MindTap Course List)
9th Edition
ISBN:9781305260948
Author:Irvin B. Tucker
Publisher:Irvin B. Tucker
Chapter11: Gross Domestic Product
Section: Chapter Questions
Problem 8SQP
Question
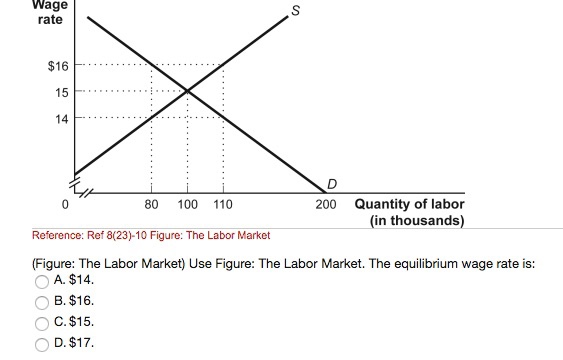
Transcribed Image Text:Wage
rate
$16
15
14
S
0
80
100
110
Reference: Ref8(23)-10 Figure: The Labor Market
200 Quantity of labor
(in thousands)
(Figure: The Labor Market) Use Figure: The Labor Market. The equilibrium wage rate is:
A. $14.
B. $16.
C. $15.
D. $17.
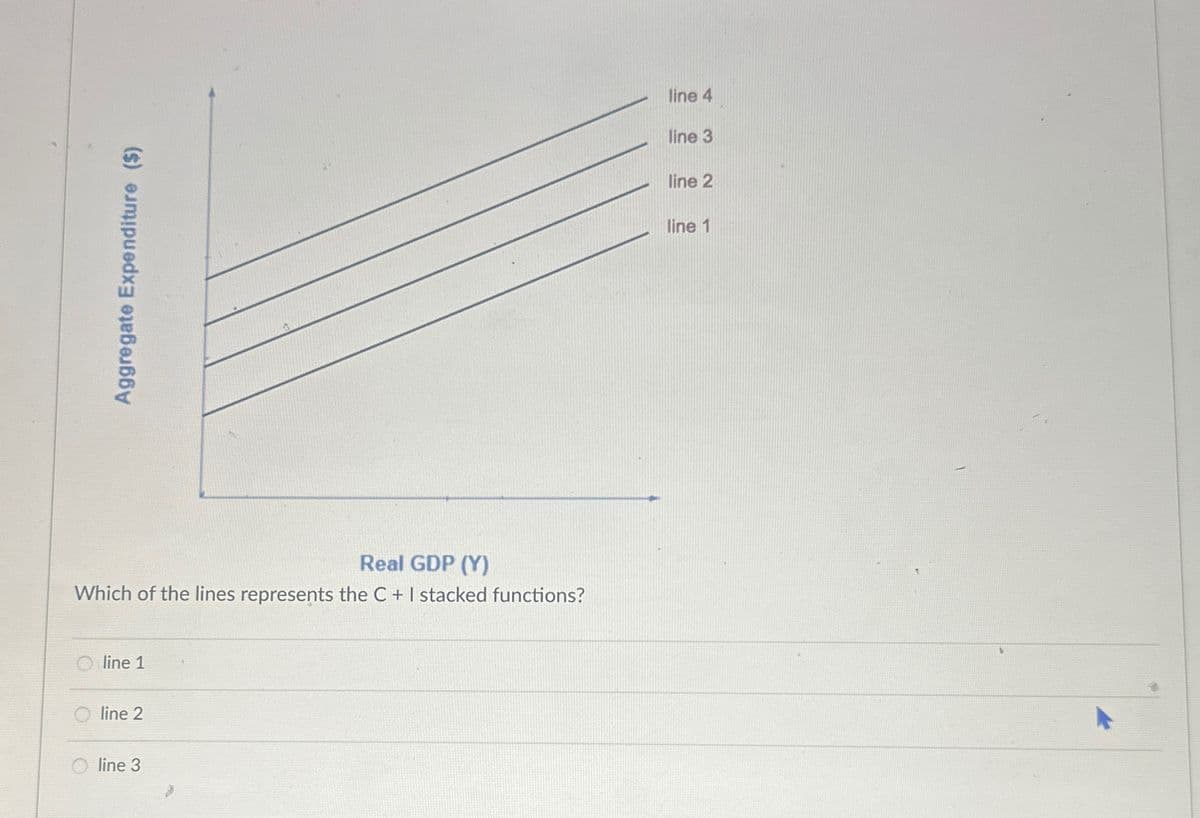
Transcribed Image Text:Aggregate Expenditure ($)
3
Real GDP (Y)
Which of the lines represents the C + I stacked functions?
line 1
line 2
line 3
line 4
line 3
line 2
line 1
Expert Solution
This question has been solved!
Explore an expertly crafted, step-by-step solution for a thorough understanding of key concepts.

Step by step
Solved in 2 steps

Recommended textbooks for you
Survey of Economics (MindTap Course List)
Economics
ISBN:
9781305260948
Author:
Irvin B. Tucker
Publisher:
Cengage Learning

Survey of Economics (MindTap Course List)
Economics
ISBN:
9781305260948
Author:
Irvin B. Tucker
Publisher:
Cengage Learning