ai In a survey of 220 males ages 20 to 24, 41% were neither in school nor working. In a survey of 230 females ages 20 to 24, 45% were neither in school nor working. These samples are random and independent. At a = 0.10, can you support the claim that the proportion of males ages 20 to 24 who were neither in school nor working is less than the proportion of females ages 20 to 24 who were neither in school nor working? Complete parts (a) through (e) below. (a) Identify the claim and state Ho and Ha the proportion of The claim is "the proportion of males ages 20 to 24 who were neither in school nor working is females ages 20 to 24 who were neither in school nor working." Let P₁ and P2 be the two population proportions for males and females, respectively. State Ho and Ha Choose the correct answer below. OA. Ho: P1 P2 B. Ho: P₁ SP2 Ha: P1 P2 OC. Ho: P1 P2 Ha: P₁ = P2 Ha: P1 P2 OF. Ho: P1 P2 O D. Ho: P1 P2 OE. Ho: P12 P2 Ha: P1 < P2 Ha: P1 P2 Ha: P₁ P2 e. (b) Find the critical value(s) and identify the rejection region(s). C The critical value(s) is(are). St (Use a comma to separate answers as needed. Round to two decimal places as needed.) N. 13
ai In a survey of 220 males ages 20 to 24, 41% were neither in school nor working. In a survey of 230 females ages 20 to 24, 45% were neither in school nor working. These samples are random and independent. At a = 0.10, can you support the claim that the proportion of males ages 20 to 24 who were neither in school nor working is less than the proportion of females ages 20 to 24 who were neither in school nor working? Complete parts (a) through (e) below. (a) Identify the claim and state Ho and Ha the proportion of The claim is "the proportion of males ages 20 to 24 who were neither in school nor working is females ages 20 to 24 who were neither in school nor working." Let P₁ and P2 be the two population proportions for males and females, respectively. State Ho and Ha Choose the correct answer below. OA. Ho: P1 P2 B. Ho: P₁ SP2 Ha: P1 P2 OC. Ho: P1 P2 Ha: P₁ = P2 Ha: P1 P2 OF. Ho: P1 P2 O D. Ho: P1 P2 OE. Ho: P12 P2 Ha: P1 < P2 Ha: P1 P2 Ha: P₁ P2 e. (b) Find the critical value(s) and identify the rejection region(s). C The critical value(s) is(are). St (Use a comma to separate answers as needed. Round to two decimal places as needed.) N. 13

Holt Mcdougal Larson Pre-algebra: Student Edition 2012
1st Edition
ISBN:9780547587776
Author:HOLT MCDOUGAL
Publisher:HOLT MCDOUGAL
Chapter11: Data Analysis And Probability
Section: Chapter Questions
Problem 8CR

Related questions
Question
Transcribed Image Text:ai
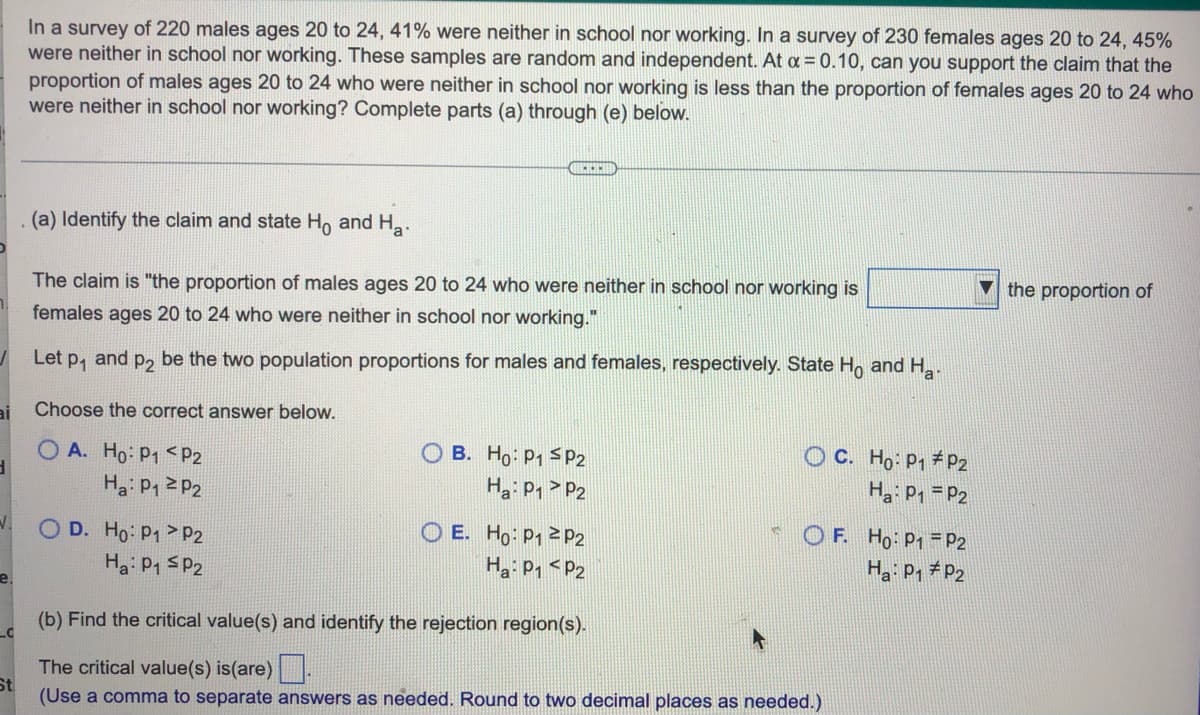
In a survey of 220 males ages 20 to 24, 41% were neither in school nor working. In a survey of 230 females ages 20 to 24, 45%
were neither in school nor working. These samples are random and independent. At a = 0.10, can you support the claim that the
proportion of males ages 20 to 24 who were neither in school nor working is less than the proportion of females ages 20 to 24 who
were neither in school nor working? Complete parts (a) through (e) below.
(a) Identify the claim and state Ho and Ha.
the proportion of
The claim is "the proportion of males ages 20 to 24 who were neither in school nor working is
females ages 20 to 24 who were neither in school nor working."
Let P₁
and P2 be the two population proportions for males and females, respectively. State Ho and Ha
Choose the correct answer below.
OA. Ho: P1 P2
B. Ho: P₁ SP2
OC. Ho: P1 P2
Ha: P₁ = P2
Ha: P₁
P2
Ha: P₁ P2
OF. Ho: P1
P2
O D. Ho: P1
P2
OE. Ho: P12 P2
На: P1 < P2
Ha: P1
P2
Ha: P₁ P2
e.
(b) Find the critical value(s) and identify the rejection region(s).
C
The critical value(s) is(are).
St
(Use a comma to separate answers as needed. Round to two decimal places as needed.)
N.
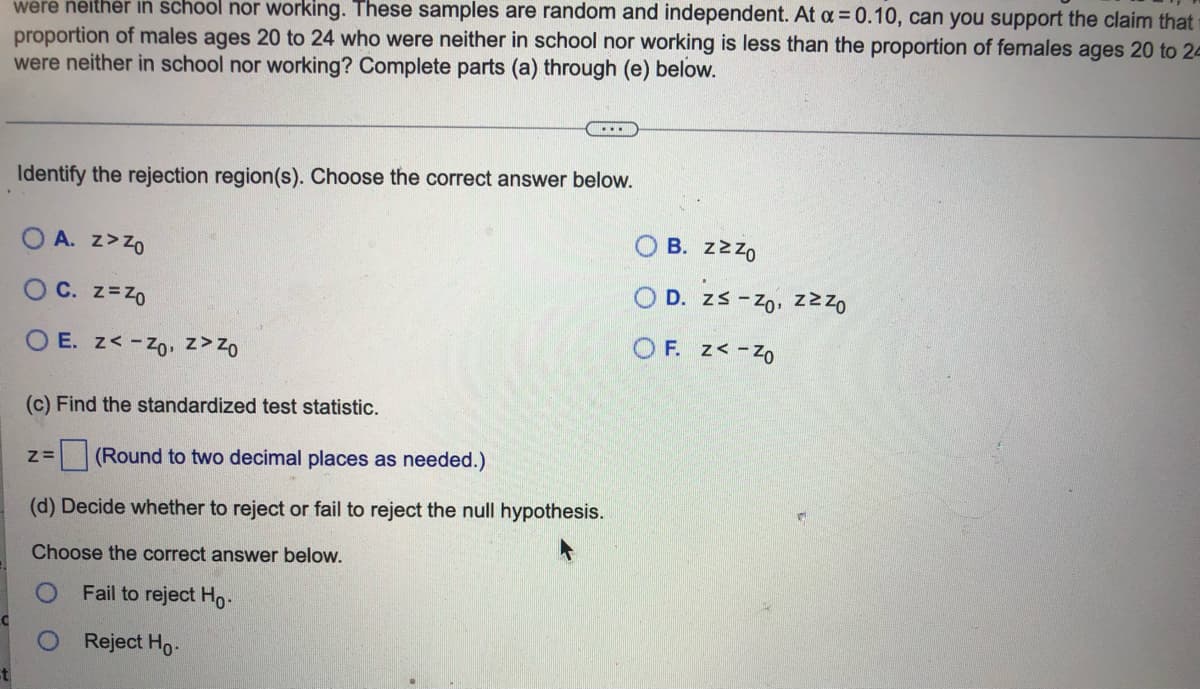
Transcribed Image Text:were neither in school nor working. These samples are random and independent. At α = 0.10, can you support the claim that
proportion of males ages 20 to 24 who were neither in school nor working is less than the proportion of females ages 20 to 2-
were neither in school nor working? Complete parts (a) through (e) below.
...
Identify the rejection region(s). Choose the correct answer below.
Β. ΖΣΖΟ
OA. Z>Zo
OD. zs - Zo, zzzo
OC. Z=Z0
OF. z<-Z0
OE. z<-Zo, z> Zo
(c) Find the standardized test statistic.
Z= (Round to two decimal places as needed.)
(d) Decide whether to reject or fail to reject the null hypothesis.
Choose the correct answer below.
Fail to reject Ho
Reject Ho.
st
Expert Solution
This question has been solved!
Explore an expertly crafted, step-by-step solution for a thorough understanding of key concepts.

Step by step
Solved in 2 steps with 2 images

Recommended textbooks for you
Holt Mcdougal Larson Pre-algebra: Student Edition…
Algebra
ISBN:
9780547587776
Author:
HOLT MCDOUGAL
Publisher:
HOLT MCDOUGAL


College Algebra (MindTap Course List)
Algebra
ISBN:
9781305652231
Author:
R. David Gustafson, Jeff Hughes
Publisher:
Cengage Learning
Holt Mcdougal Larson Pre-algebra: Student Edition…
Algebra
ISBN:
9780547587776
Author:
HOLT MCDOUGAL
Publisher:
HOLT MCDOUGAL
College Algebra (MindTap Course List)
Algebra
ISBN:
9781305652231
Author:
R. David Gustafson, Jeff Hughes
Publisher:
Cengage Learning