A)In the two tables in the picture, in which examples are the samples representative of the statistical population? Which are not? B)For those samples that are not representative, identify the statistical population actually sampled
A)In the two tables in the picture, in which examples are the samples representative of the statistical population? Which are not? B)For those samples that are not representative, identify the statistical population actually sampled

Functions and Change: A Modeling Approach to College Algebra (MindTap Course List)
6th Edition
ISBN:9781337111348
Author:Bruce Crauder, Benny Evans, Alan Noell
Publisher:Bruce Crauder, Benny Evans, Alan Noell
Chapter5: A Survey Of Other Common Functions
Section5.6: Higher-degree Polynomials And Rational Functions
Problem 5E: Population Genetics In the study of population genetics, an important measure of inbreeding is the...

Related questions
Question
A)In the two tables in the picture, in which examples are the samples representative of the statistical population? Which are not?
B)For those samples that are not representative, identify the statistical population actually sampled.
Transcribed Image Text:8 I Chapter One
Practice Exercises
e analaM
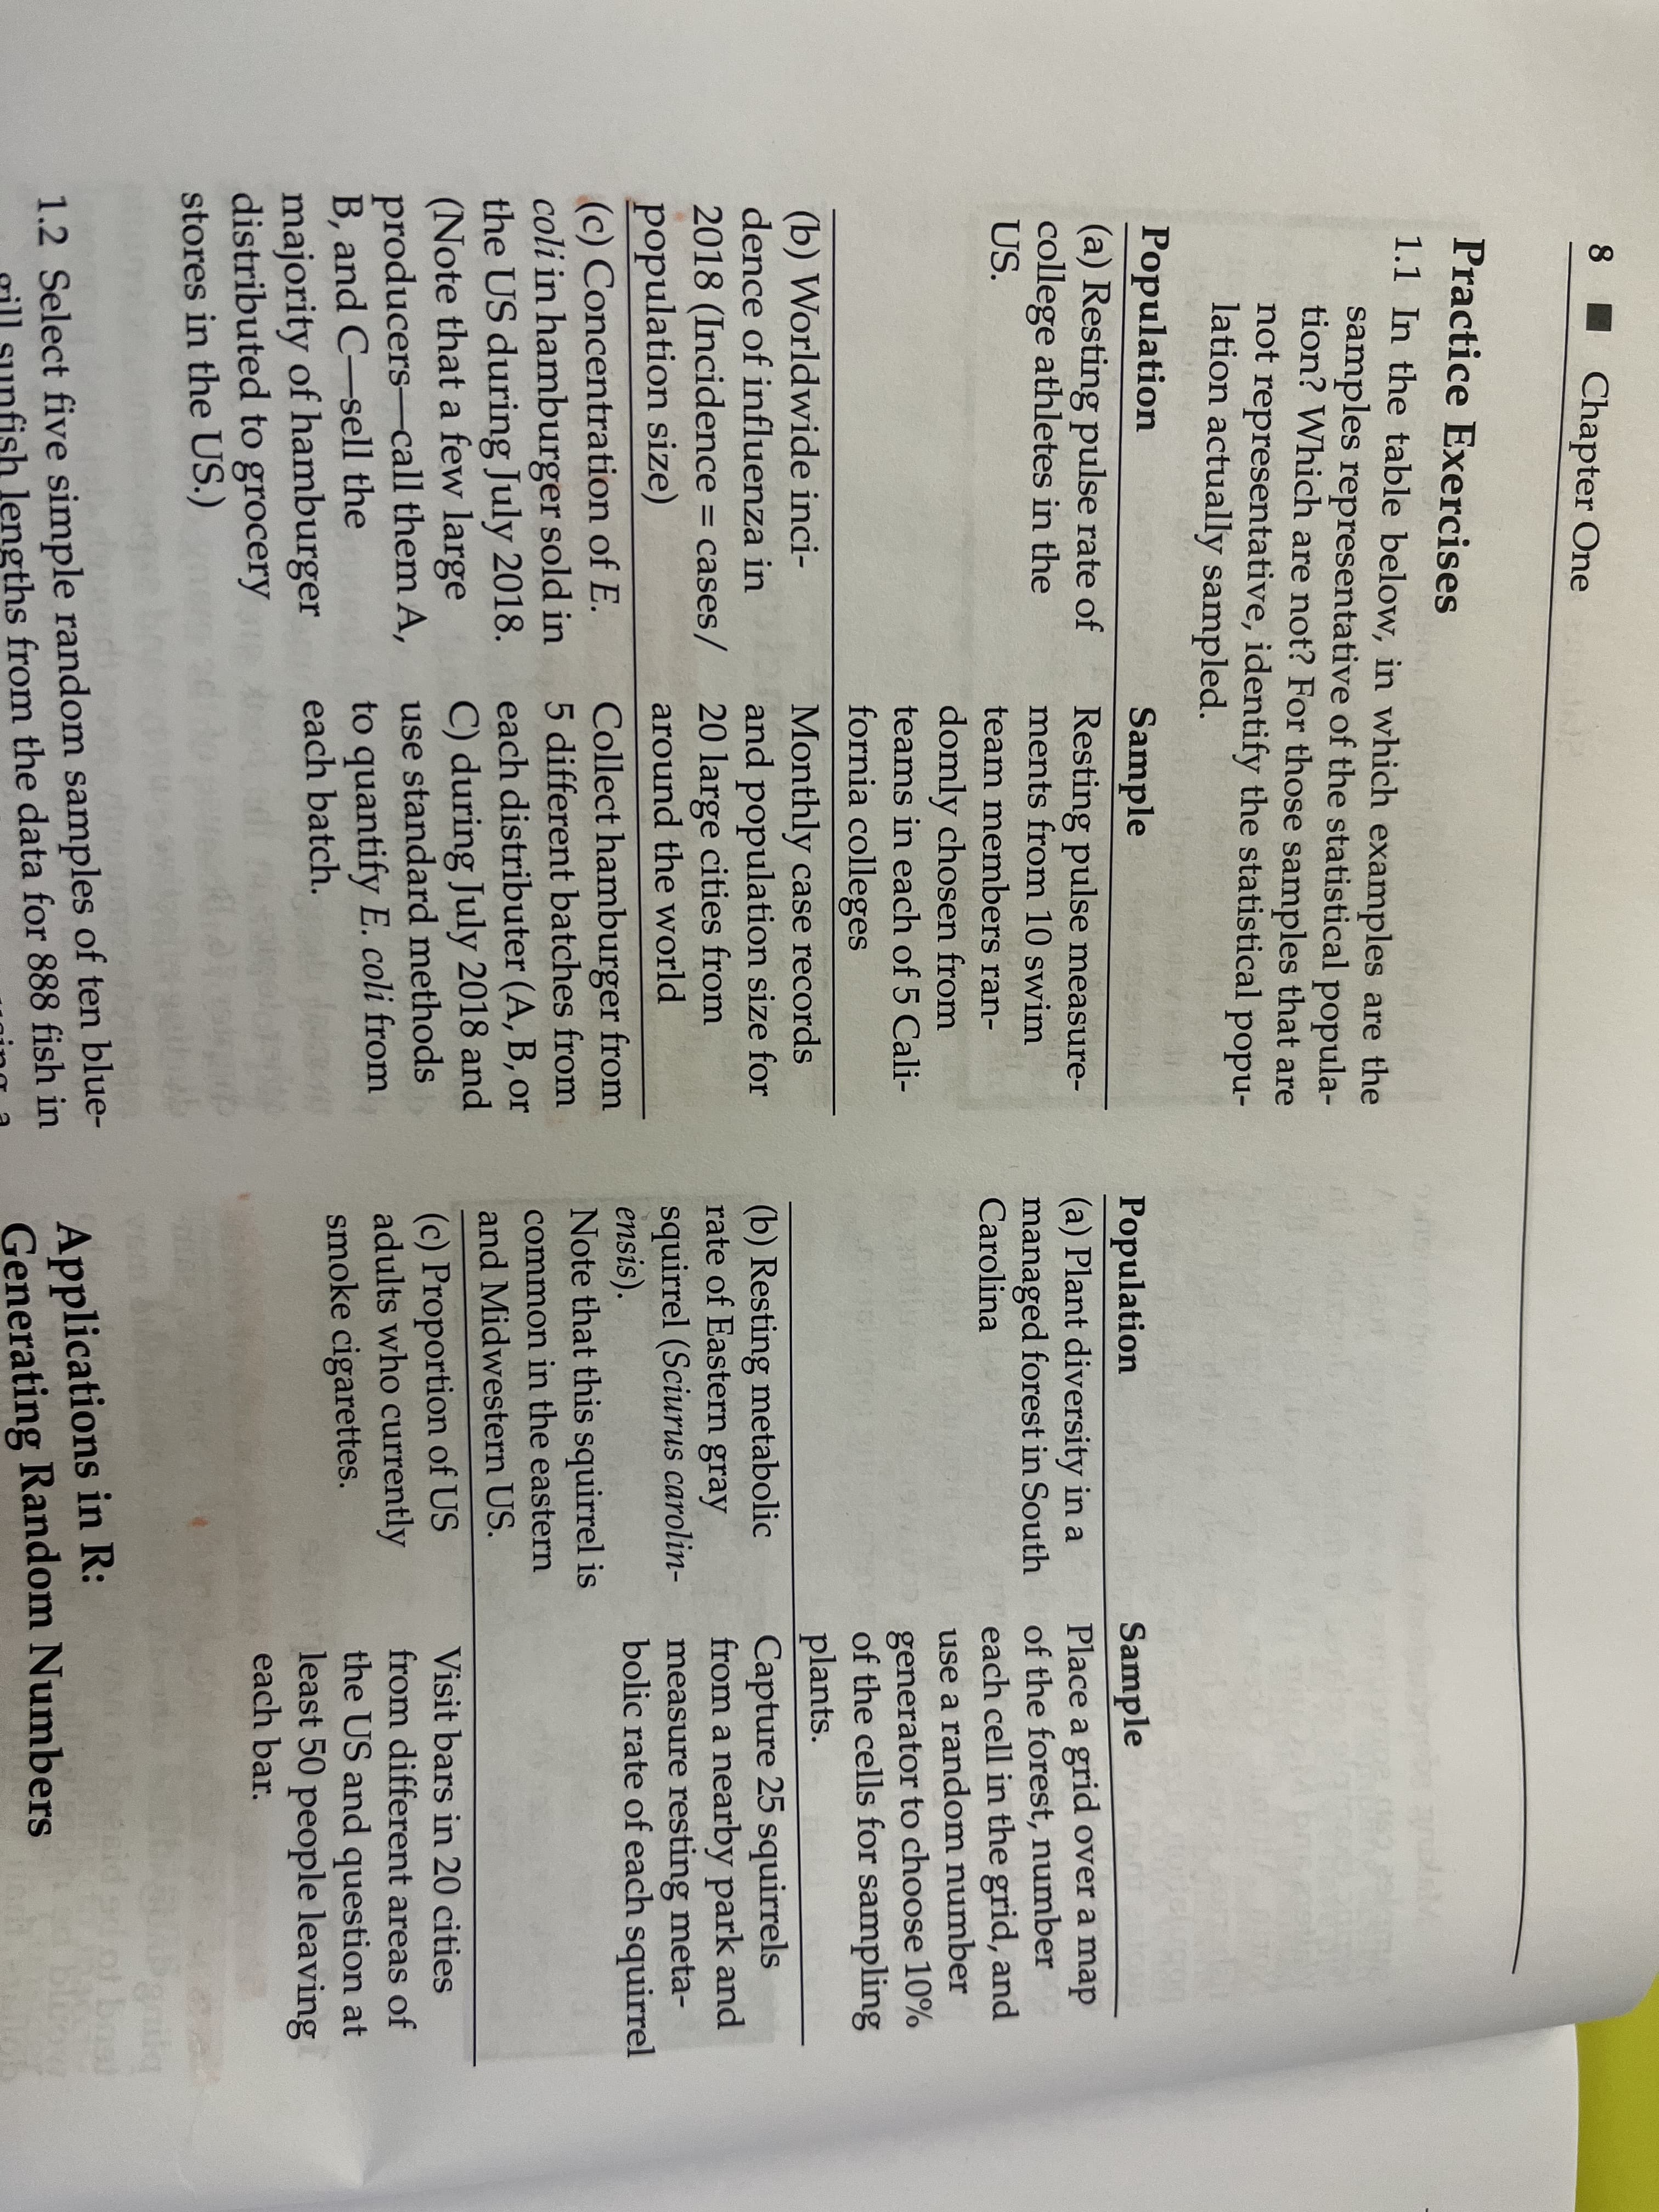
1.1 In the table below, in which examples are the
samples representative of the statistical popula-
tion? Which are not? For those samples that are
not representative, identify the statistical popu-
lation actually sampled.
Population
Sample
Sample
Place a grid over a map
of the forest, number
each cell in the grid, and
use a random number
Population
(a) Resting pulse rate of
college athletes in the
US.
Resting pulse measure-
ments from 10 swim
(a) Plant diversity in a
managed forest in South
Carolina
team members ran-
domly chosen from
teams in each of 5 Cali-
generator to choose 10%
of the cells for sampling
plants.
Capture 25 squirrels
from a nearby park and
measure resting meta-
bolic rate of each squirrel
fornia colleges
Monthly case records
and population size for
20 large cities from
around the world
(b) Worldwide inci-
dence of influenza in
(b) Resting metabolic
rate of Eastern gray
2018 (Incidence = cases/
population size)
(c) Concentration of E.
coli in hamburger sold in
the US during July 2018.
(Note that a few large
producers-call them A,
B, and C-sell the
majority of hamburger
distributed to grocery
stores in the US.)
squirrel (Sciurus carolin-
ensis).
Note that this squirrel is
Collect hamburger from
5 different batches from
common in the eastern
each distributer (A, B, or
C) during July 2018 and
use standard methods
and Midwestern US.
(c) Proportion of US
adults who currently
smoke cigarettes.
Visit bars in 20 cities
from different areas of
to quantify E. coli from
each batch.
the US and question at
least 50 people leaving
each bar.
1.2 Select five simple random samples of ten blue-
gill sunfish lengths from the data for 888 fish in
Applications in R:
Generating Random Numbers
of bast
blue
ing
Expert Solution
This question has been solved!
Explore an expertly crafted, step-by-step solution for a thorough understanding of key concepts.

This is a popular solution!

Trending now
This is a popular solution!

Step by step
Solved in 3 steps

Recommended textbooks for you
Functions and Change: A Modeling Approach to Coll…
Algebra
ISBN:
9781337111348
Author:
Bruce Crauder, Benny Evans, Alan Noell
Publisher:
Cengage Learning

Holt Mcdougal Larson Pre-algebra: Student Edition…
Algebra
ISBN:
9780547587776
Author:
HOLT MCDOUGAL
Publisher:
HOLT MCDOUGAL

Algebra & Trigonometry with Analytic Geometry
Algebra
ISBN:
9781133382119
Author:
Swokowski
Publisher:
Cengage
Functions and Change: A Modeling Approach to Coll…
Algebra
ISBN:
9781337111348
Author:
Bruce Crauder, Benny Evans, Alan Noell
Publisher:
Cengage Learning
Holt Mcdougal Larson Pre-algebra: Student Edition…
Algebra
ISBN:
9780547587776
Author:
HOLT MCDOUGAL
Publisher:
HOLT MCDOUGAL
Algebra & Trigonometry with Analytic Geometry
Algebra
ISBN:
9781133382119
Author:
Swokowski
Publisher:
Cengage