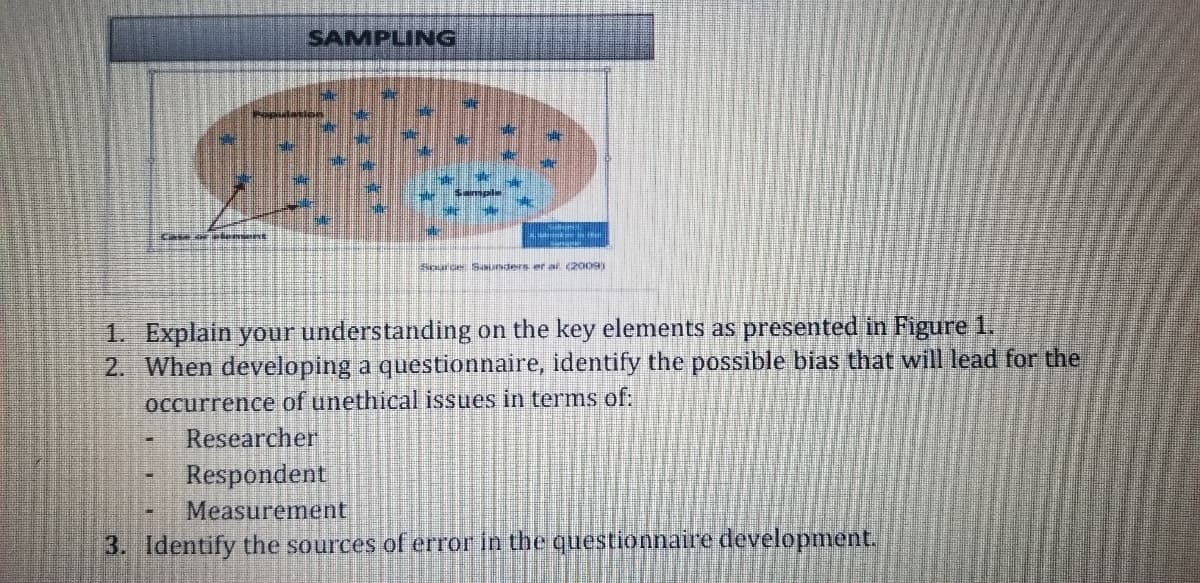
SAMPLING Source Saunders er al (2009)
Q: The employees of a subsidiary that does asbestos cleanup are being tested for indications of…
A:
Q: For the following table represents the statistical data for ages and their frequencies. Find the…
A: Given. R=N+5+G N=43, G=1 R=43+5+1=49 We will calculate frequency according to the table. We have…
Q: sample of 5000 people found that they walk an average of 7km with a variance of 400. Using both the…
A: n=5000 So (degree of freedom =(n-1)=4999) Population variance is unknown So we will use t test…
Q: 6. Suppose it is up to you to determine if a certain state (New York) receives a significantly…
A:
Q: about 34 and a standard deviation of 11. Suppose that one individual is randomly chosen. Let…
A:
Q: The table below shows the agreement and disagreement of two raters evaluating a questionnaire…
A: Since you have posted a question with multiple sub-parts, we will solve first three subparts for…
Q: Find the following probability for the standard normal random variable z. a. P(−1.96≤z<−0.22)…
A: Given a. P(−1.96≤z<−0.22) b. P(z≥0) c. P(−2.35≤z≤1.45)…
Q: 14. A researcher collected data from a sample that she chose and she wishes to understand the…
A: The following information has been given: Observed Frequencies: Performance Productivity Total…
Q: 2. Calculate the variance and standard deviation for the following data set: x: 1.4 1.9 2.4 2.9 3.4…
A: Data for X and n is given, We have to calculate variance and standard deviation and outliers for…
Q: Draw a cumulative frequency histogram and a cumulative frequency polygon. 30 27 [1mk]
A: Statisticians use histogram and cumulative frequency polygon to have a visual representation of the…
Q: Please use the standard normal distribution to find P(- 2.25 < z < 0).
A: From the provided information, The expression is P (-2.25 < z < 0)
Q: A certain medication is known to increase the pulse rate of its users. The standard deviation of the…
A:
Q: Calculate the Coefficient of rank correlation: Mathematic Statistics S 3 6 5 8 9 4 B 7 1 10 2 2 3 1…
A: Given data is Mathematics Statistics 3 6 5 4 8 9 4 8 7 1 10 2 2 3 1 10 6 5 9…
Q: At a fishery, the largest catches in August were of blackfin tuna, sailfish, blue marlin, and king…
A: Given Blackfin tuna SD=2.61 Sailfish SD=4.61 Blue marlin SD=1.97 King mackerel SD=6.67
Q: b) Suppose you are given the following information for an OLS regression: Σxivi: Xi Yi 830102, T =…
A: Since you have posted a question with multiple sub-parts, we will solve the first three sub-parts…
Q: I. Read each item and choose the correct answer. Write your answer before the number. 1. If you…
A: Percentile is the value below which a given percentage of observations is expected to fall. If a…
Q: Let X₁,..., Xn be iid Poisson(A), and let λ have a gamma(a, 3) distribution, the conjugate family…
A:
Q: If on an everage rain falls on 12 days in every 30 days, find the probability (i) that the first 4…
A:
Q: A publisher reports that 36% of their readers own a laptop. A marketing executive wants to test the…
A: From the provided information, Sample size (n) = 320 Sample proportion (p̂) = 0.30 Level of…
Q: A service station owner believes that equal numbers of customers prefer to buy gasoline on every day…
A: Given: Significance level α = 0.025 n = 7 Formula Used: Test-statistic χ2 = ∑(Oi-Ei)2E Where, Oi…
Q: A general contracting firm experiences cost overruns on 25% of its contracts. In a company audit, 20…
A: Here given , A general contracting firm experiences cost overruns on 25% of its contracts. In a…
Q: Data Management - Statisitcal Analysis Describe each graph seperately. Explain the type of graph…
A: Given two graphs and we have to Describe each graph seperately.
Q: 1. What is the value of the correlation between Academic Performance and Digital Literacy? A. r =…
A: Given data is
Q: The amount of damage done by a named storm is impacted in part by the number of days the storm stays…
A: Discrete random variable: A random variable is said to be discrete if its value is countable such as…
Q: L.Direction: Write the letter that corresponds to the correct answer. 1. Data collected using…
A: For the given mcq's , we need to choose the correct option.
Q: Find the value of 1 1 1 (1+ a) 1 1 18- ( 1² + ²b) |
A:
Q: weight of 2 ounces. As population standard deviation is 7.5 ounces. Based on this, construct a 99%…
A: Given Sample mean=72 Sample size=37 Population standard deviation =7.5
Q: The average student loan debt for college graduates is $25,000. Suppose that that distribution is…
A: Solution
Q: hange: 2016 2017 2018 2019 2020 2021 2,465 2,092 1,783 1,513 1,287 1,094 What is the…
A: year (x) = independent variable The Bluegill population (y) = dependent variable Year (x)…
Q: d) How many of the employees washed dishes or operated the cash register but did not cook food?…
A: (d)From the question given data is Let A--->cooked food Let B--->Washing dishes Let…
Q: independent-measures experiment comparing three different treatment conditions. Treatment 1…
A:
Q: A math teacher claims that the mean scores on a math assessment test for fourth grade boys and girls…
A: The provided information is x¯2=151x¯2=149s1=36s2=34n1=13n2=15α=0.01 a.The null and alternative…
Q: In a study about children's pocket money, two samples of schoolchildren were asked how much money…
A: Combined mean=n1x1+n2x2n1+n2 Given that, n1=first sample size of childrens pocket money=87 x1=first…
Q: For the given data set: x |80|172 y 2 15 11 5 19 6 13 2
A: Steps of create scatter Plot; 1. Enter the data in excel then, 2. Go to insert --- scatter plot…
Q: Make a visualization using excel and interpret (show the step by step process in excel)
A: The data has five categories which are compared over two time periods- 1910 and 2003. The best…
Q: The following are ages of 17 of the signers of the Declaration of Independence. 48, 52, 55, 50, 33,…
A:
Q: and Y₂ If fx₁x₂ (x₁, x₂) is a joint density function, then find the joint density function of
A:
Q: The time required to finish an assembly job is believed to be normally distributed with a standard…
A: here given , standard deviation = σ = 16 minute
Q: Fill in the P (X=x) values to give a legitimate probability distribution for the discrete random…
A:
Q: What is helpful to interpret bivariate tables~ percentages or frequencies?
A: Given that We have to define What is helpful to interpret bivariate tables percentages or…
Q: 10. Suppose approximately 95 % of people who wrote a standardised test had marks that ranged fro…
A:
Q: On the planet of Mercury, 4-year-olds average 3.2 hours a day unsupervised. Most of the unsupervised…
A: On an average 3.2 hours a day unsupervised The standard deviation is 1.4 hours μ=3.2σ=1.4
Q: Direction: Make a grouped FDT of the ungrouped FDT. Write your answers in your. answer sheet.
A: Grouped Frequency distribution table (FDT) To construct a…
Q: Find the P-value for the following values. of the test statistic t, Sample size n, and alternate…
A: Here, Given t statistics= t=-1. 584 n=19 H1: μ≠μ0 therefore test is two sided. here level of…
Q: The table summarizes results from 976 pedestrian deaths that were caused by automobile accidents.…
A:
Q: Suppose a large labor union wishes to estimate the mean number of hours per month a union member is…
A: Please see below
Q: What is needed to investigate the strength of a relationship?
A: We have to write What is needed to investigate the strength of a relationship.
Q: The college is planning to add a food vender in the student union and would like to know what type…
A: Given n=3
Q: The data below are from an independent-measures experiment comparing three different treatment…
A:
Q: 10. Suppose approximately 95 % of people who wrote a standardised test had marks that ranged from 78…
A: here given , Suppose approximately 95 % of people who wrote a standardised test had marks that…
Step by step
Solved in 2 steps