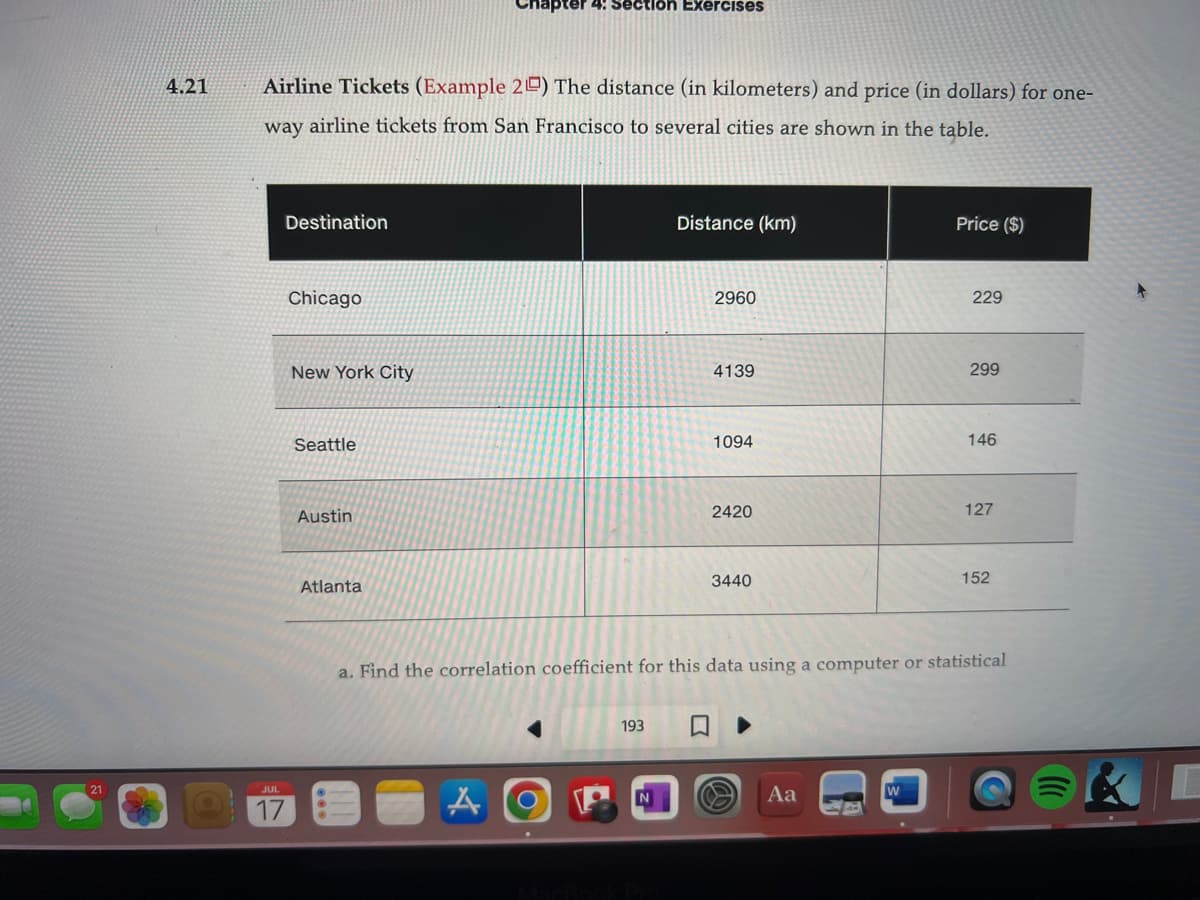
Airline Tickets (Example 20) The distance (in kilometers) and price (in dollars) for one- way airline tickets from San Francisco to several cities are shown in the table.
Airline Tickets (Example 20) The distance (in kilometers) and price (in dollars) for one- way airline tickets from San Francisco to several cities are shown in the table.

Glencoe Algebra 1, Student Edition, 9780079039897, 0079039898, 2018
18th Edition
ISBN:9780079039897
Author:Carter
Publisher:Carter
Chapter4: Equations Of Linear Functions
Section4.5: Correlation And Causation
Problem 23PFA

Related questions
Question
4.21
Transcribed Image Text:4.21
Airline Tickets (Example 20) The distance (in kilometers) and price (in dollars) for one-
way airline tickets from San Francisco to several cities are shown in the table.
17
Destination
Chicago
New York City
Seattle
Austin
hapter 4: Section Exercises
Atlanta
AO
Distance (km)
193
2960
4139
1094
2420
3440
Aa
Price ($)
W
229
299
a. Find the correlation coefficient for this data using a computer or statistical
146
127
152
Transcribed Image Text:194
21
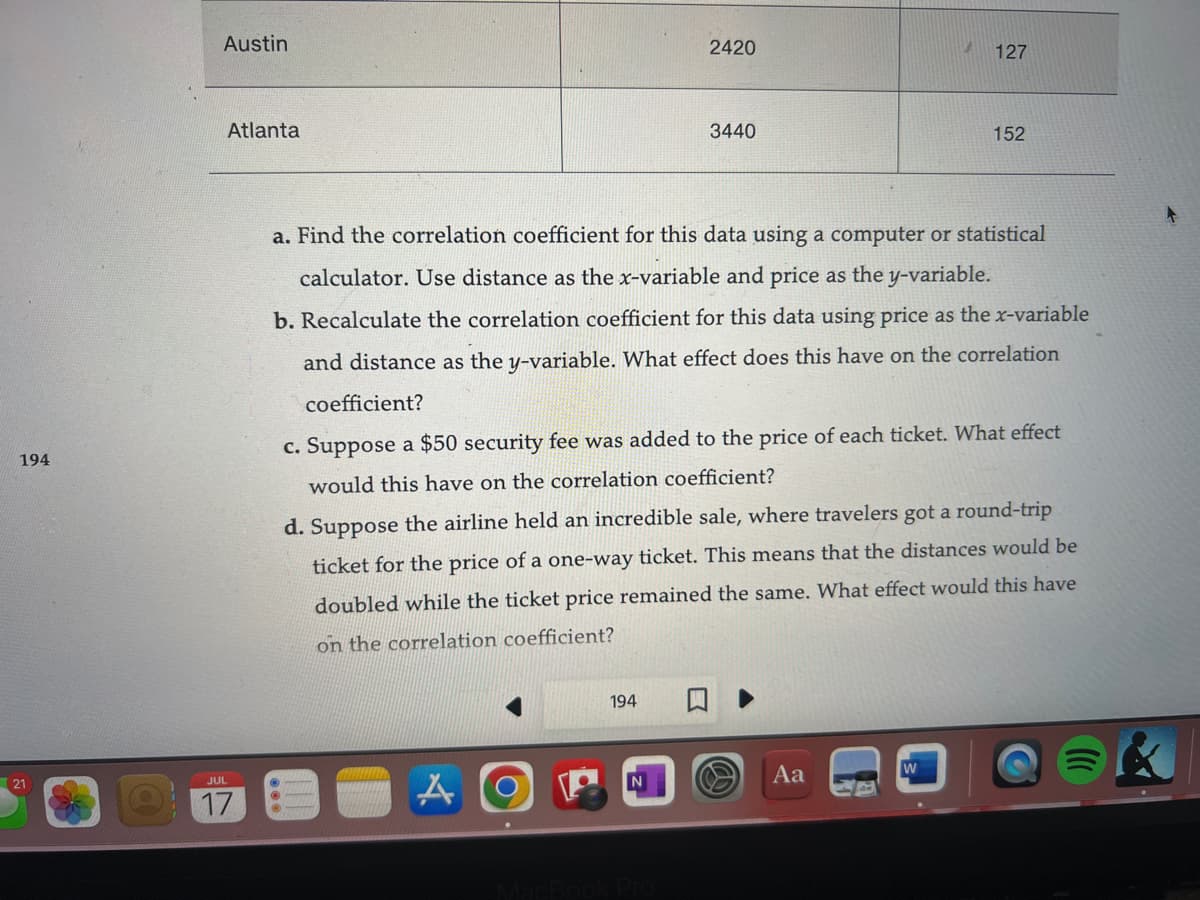
Austin
Atlanta
JUL
17
Ⓒ
2420
3440
a. Find the correlation coefficient for this data using a computer or statistical
calculator. Use distance as the x-variable and price as the y-variable.
b. Recalculate the correlation coefficient for this data using price as the x-variable
and distance as the y-variable. What effect does this have on the correlation
coefficient?
A
194
c. Suppose a $50 security fee was added to the price of each ticket. What effect
would this have on the correlation coefficient?
127
d. Suppose the airline held an incredible sale, where travelers got a round-trip
ticket for the price of a one-way ticket. This means that the distances would be
doubled while the ticket price remained the same. What effect would this have
on the correlation coefficient?
152
Aa
W
Expert Solution
This question has been solved!
Explore an expertly crafted, step-by-step solution for a thorough understanding of key concepts.

This is a popular solution!

Trending now
This is a popular solution!

Step by step
Solved in 4 steps with 3 images

Recommended textbooks for you
Glencoe Algebra 1, Student Edition, 9780079039897…
Algebra
ISBN:
9780079039897
Author:
Carter
Publisher:
McGraw Hill
Glencoe Algebra 1, Student Edition, 9780079039897…
Algebra
ISBN:
9780079039897
Author:
Carter
Publisher:
McGraw Hill