alculate the ratios of Woolworths Group (Australian retail company) for the year 2019: Ratios to calculate: Profitability (ROSF, ROCE, Gross margin, Operating profit margin, Cash flow to Sales*) Efficiency (Inventory turnover period, Average settlement period, Sales revenue to capital employed) Liquidity (Current ratio, Acid test (quick) ratio, Cash flow ratio*). Stability/Capital Structure (Gearing ratio, Interest cover ratio, Debt coverage ratio*) Investment/Market Performance (Earnings per share, Price earnings ratio, Operating cash flow per share*)
alculate the ratios of Woolworths Group (Australian retail company) for the year 2019: Ratios to calculate: Profitability (ROSF, ROCE, Gross margin, Operating profit margin, Cash flow to Sales*) Efficiency (Inventory turnover period, Average settlement period, Sales revenue to capital employed) Liquidity (Current ratio, Acid test (quick) ratio, Cash flow ratio*). Stability/Capital Structure (Gearing ratio, Interest cover ratio, Debt coverage ratio*) Investment/Market Performance (Earnings per share, Price earnings ratio, Operating cash flow per share*)

Intermediate Accounting: Reporting And Analysis
3rd Edition
ISBN:9781337788281
Author:James M. Wahlen, Jefferson P. Jones, Donald Pagach
Publisher:James M. Wahlen, Jefferson P. Jones, Donald Pagach
Chapter5: The Income Statement And The Statement Of Cash Flows
Section: Chapter Questions
Problem 13E: Classifications Where would each of the following items most likely be reported in a companys...

Related questions
Question
100%
Calculate the ratios of Woolworths Group (Australian retail company) for the year 2019:
Ratios to calculate:
Profitability (ROSF, ROCE, Gross margin, Operating profit margin, Cash flow to Sales*)
Efficiency (Inventory turnover period, Average settlement period, Sales revenue to capital employed)
Stability/Capital Structure (Gearing ratio, Interest cover ratio, Debt coverage ratio*)
Investment/Market Performance (Earnings per share, Price earnings ratio, Operating cash flow per share*)
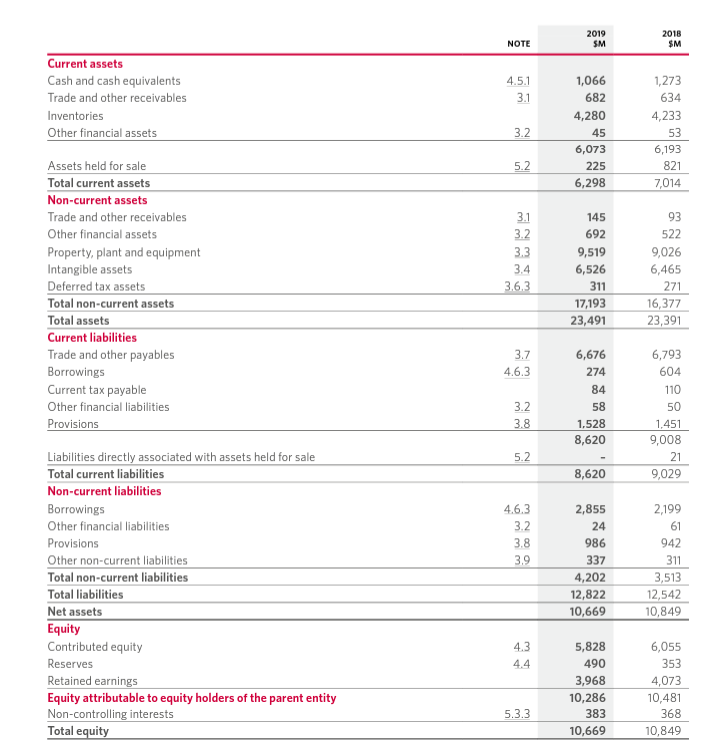
Transcribed Image Text:Current assets
Cash and cash equivalents
Trade and other receivables
Inventories
Other financial assets
Assets held for sale
Total current assets
Non-current assets
Trade and other receivables
Other financial assets
Property, plant and equipment
Intangible assets
Deferred tax assets
Total non-current assets
Total assets
Current liabilities
Trade and other payables
Borrowings
Current tax payable
Other financial liabilities
Provisions
Liabilities directly associated with assets held for sale
Total current liabilities
Non-current liabilities
Borrowings
Other financial liabilities
Provisions
Other non-current liabilities
Total non-current liabilities
Total liabilities
Net assets
Equity
Contributed equity
Reserves
Retained earnings
Equity attributable to equity holders of the parent entity
Non-controlling interests
Total equity
NOTE
4.5.1
3.1
3.2
5.2
3.1
3.2
3.3
3.4
3.6.3
3.7
a w
4.6.3
mm
3.2
100 IN
3.8
5.2
4.6.3
3.2
3.8
3.9
4.3
4.4
5.3.3
2019
SM
1,066
682
4,280
45
6,073
225
6,298
145
692
9,519
6,526
311
17,193
23,491
6,676
274
84
58
1,528
8,620
8,620
2,855
24
986
337
4,202
12,822
10,669
5,828
490
3,968
10,286
383
10,669
2018
$M
1,273
634
4,233
53
6,193
821
7,014
93
522
9,026
6,465
271
16,377
23,391
6,793
604
110
50
1,451
9,008
21
9,029
2,199
61
942
311
3,513
12,542
10,849
6,055
353
4,073
10,481
368
10,849
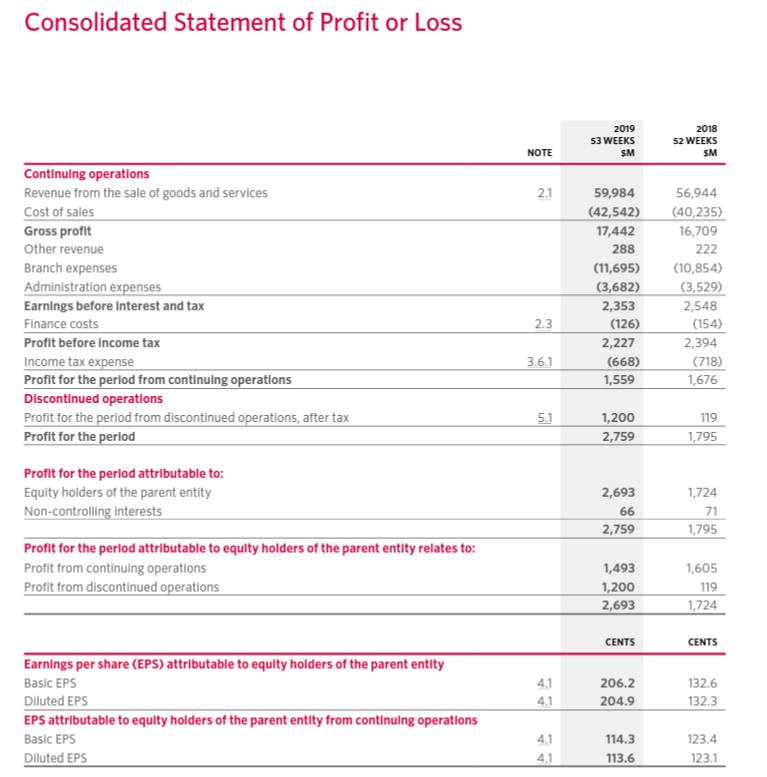
Transcribed Image Text:Consolidated Statement of Profit or Loss
Continuing operations
Revenue from the sale of goods and services
Cost of sales
Gross profit
Other revenue
Branch expenses
Administration expenses
Earnings before Interest and tax
Finance costs
Profit before income tax
Income tax expense
Profit for the period from continuing operations
Discontinued operations
Profit for the period from discontinued operations, after tax
Profit for the period
Profit for the period attributable to:
Equity holders of the parent entity
Non-controlling interests
Profit for the period attributable to equity holders of the parent entity relates to:
Profit from continuing operations
Profit from discontinued operations
Earnings per share (EPS) attributable to equity holders of the parent entity
Basic EPS
Diluted EPS
EPS attributable to equity holders of the parent entity from continuing operations
Basic EPS
Diluted EPS
NOTE
2.1
2.3
3.6.1
5.1
4.1
4.1
4.1
4.1
2019
53 WEEKS
SM
59,984
(42,542)
17,442
288
(11,695)
(3,682)
2,353
(126)
2,227
(668)
1,559
1,200
2,759
2,693
66
2,759
1,493
1,200
2,693
CENTS
206.2
204.9
114.3
113.6
2018
52 WEEKS
SM
56,944
(40,235)
16,709
222
(10,854)
(3,529)
2,548
(154)
2,394
(718)
1,676
119
1,795
1,724
71
1,795
1,605
119
1,724
CENTS
132.6
132.3
123.4
123.1
Expert Solution
This question has been solved!
Explore an expertly crafted, step-by-step solution for a thorough understanding of key concepts.

Step by step
Solved in 4 steps

Knowledge Booster


Learn more about
Need a deep-dive on the concept behind this application? Look no further. Learn more about this topic, accounting and related others by exploring similar questions and additional content below.Recommended textbooks for you
Intermediate Accounting: Reporting And Analysis
Accounting
ISBN:
9781337788281
Author:
James M. Wahlen, Jefferson P. Jones, Donald Pagach
Publisher:
Cengage Learning

Managerial Accounting
Accounting
ISBN:
9781337912020
Author:
Carl Warren, Ph.d. Cma William B. Tayler
Publisher:
South-Western College Pub

College Accounting (Book Only): A Career Approach
Accounting
ISBN:
9781337280570
Author:
Scott, Cathy J.
Publisher:
South-Western College Pub
Intermediate Accounting: Reporting And Analysis
Accounting
ISBN:
9781337788281
Author:
James M. Wahlen, Jefferson P. Jones, Donald Pagach
Publisher:
Cengage Learning
Managerial Accounting
Accounting
ISBN:
9781337912020
Author:
Carl Warren, Ph.d. Cma William B. Tayler
Publisher:
South-Western College Pub
College Accounting (Book Only): A Career Approach
Accounting
ISBN:
9781337280570
Author:
Scott, Cathy J.
Publisher:
South-Western College Pub

Financial Accounting: The Impact on Decision Make…
Accounting
ISBN:
9781305654174
Author:
Gary A. Porter, Curtis L. Norton
Publisher:
Cengage Learning
College Accounting (Book Only): A Career Approach
Accounting
ISBN:
9781305084087
Author:
Cathy J. Scott
Publisher:
Cengage Learning

Cornerstones of Financial Accounting
Accounting
ISBN:
9781337690881
Author:
Jay Rich, Jeff Jones
Publisher:
Cengage Learning