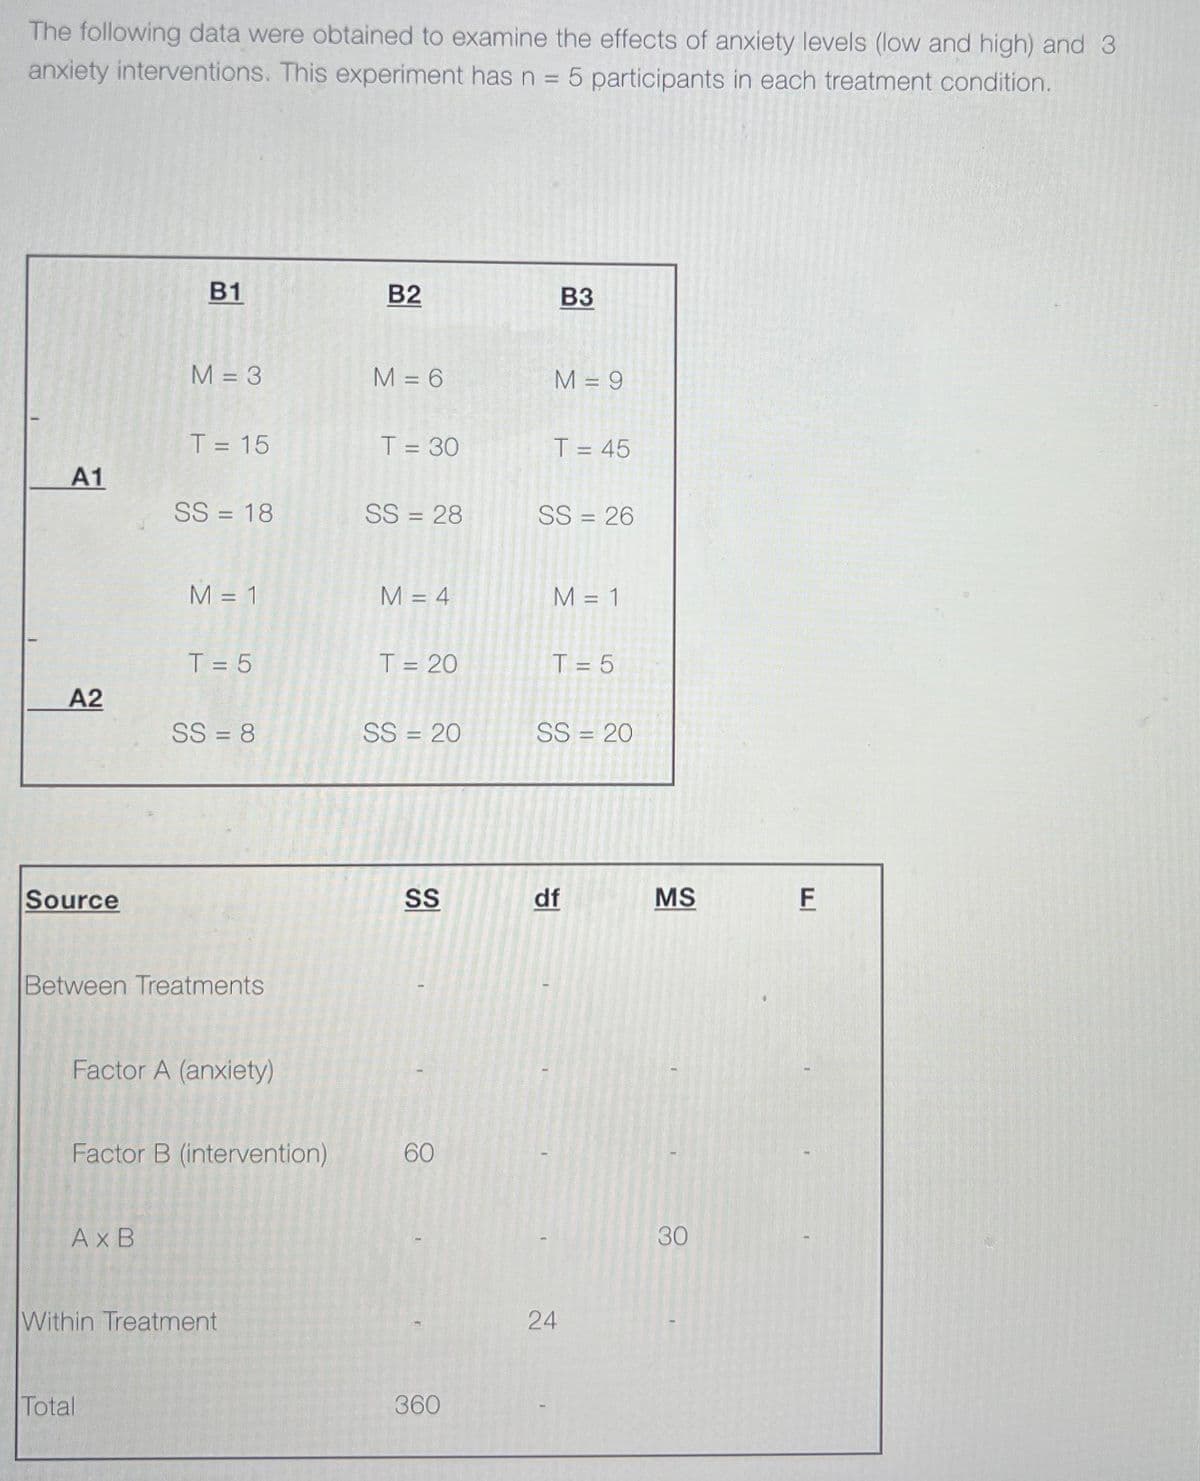
alculate the three F-ratios and state a conclusion for each test (indicate if there was an effect or not): A) Test 1: F-ratio1 = Conclusion (effect' or 'no effect'): B) Test 2: F-ratio2 = Conclusion (effect' or 'no effect'): C) Test 3: F-ratio3 = Conclusion (effect' or 'no effect'):


Q: Estimate the variance in mean mathematics SAT scores by state, using the randomly selected scores…
A:
Q: You test a hypothesis that μ S 60 liters. Your sample size is 16 shipments, sample mean is 68, and…
A: Given information:- μ=60, n=16σ=12x¯=68
Q: As part of your job as a sales manager for a local car dealership, you want to investigate the…
A:
Q: You are analyzing a confidence interval using a 90% confidence level in your analysis. You collect a…
A: The random variable X follows normal distribution. We have to find the confidence interval for the…
Q: Two-Face decided to kill time by flipping four distinct coins. Describe Two-Face's imagined scenario…
A:
Q: survey organization takes a simple random sample of 625 households from a city of 80,000 households.…
A:
Q: The mean amount of time it takes a kidney stone to pass is 14 days and the standard deviation is 6…
A: Given that Mean=14 Standard deviation=6
Q: (Use this information for questions 15-17). A researcher would like to determine if relaxation…
A: There are two dependent samples which are pre training score and post training score. We have to…
Q: You are the manager of a local bakery, and are looking to investigate if you should add a new pie to…
A:
Q: An aircraft seam requires 26 rivets. The seam will have to be reworked if any of these rivets is…
A: Given Number of rivets =26
Q: You are a web designer process engineer for a company that sells Jewelry online. You know that 35.0%…
A: For the given data Perform z test for one proportion
Q: Refer to the accompanying table, which describes results from groups of 8 births from 8 different…
A: Given that : X represents the number of girls. P(x) is the probability of x By using expectation…
Q: Calculate the sample standard deviation of the data shown. Round to two decimal places. X 22 17 29…
A: The random variable X follows normal distribution. We have to find the sample standard deviation.
Q: TV stations use ratings to decide which shows to keep or cancel. Therefore, the A. C. Nielsen…
A: Given that the TV stations use ratings to decide which shows to keep or cancel. Therefore, the A. C.…
Q: (a) According to the Merck Veterinary Manual, the average resting heart rate for a certain type of…
A: Given that (a) population mean μ =115 Sample mean =118.2 NOTE:- According to bartleby guidelines…
Q: Suppose a university advertises that its average class size is 31 or less. A student organization is…
A:
Q: Question: The p-value of a statistical test turns out to be about 2%. Which, if any, of the…
A: The p-value is the probability calculated to find evidence against the null hypo., assuming the null…
Q: Suppose that the duration of a particular type of criminal trial is known to be normally distributed…
A: Let X be the number of days from normal distribution with mean (μ) = 21 and standard deviation (σ)…
Q: for a given disease gene, specified mode of inheritance, and observed data set, if the p-value for a…
A: We have given the following statement about the chi square goodness of fit.
Q: The lengths of pregnancies in a small rural village are normally distributed with a mean of 268 days…
A: 1. Consider that the mean and standard deviation of a random variable X are µ and σ, respectively.…
Q: The joker is getting ready for a card trick for Harley Quinn. A card is selected randomly from a…
A: No. of cards in a standard deck=52 No. of hearts=13 No. of club=13 No. of diamond=13 No. of spade=13
Q: Explain what would happen to the F ratio of this analysis of variance if 2 points were added to each…
A: We need to explain what would happen to the F ratio of this analysis of variance if 2 points were…
Q: er for a ca game at the you will need to have in sto chased before the fair begins regression model,…
A:
Q: A researcher claims that the average price of kilogram of pork liempo is more than P260.00. However,…
A: Given: Population mean to be tested, μ=260Sample size, n=25Sample mean, x¯=270sample sd, s=15α=0.05
Q: a. Identify the null hypothesis and the alternative hypothesis. Choose the correct answer below. A.…
A: Given that Sample size n =169 Favorable cases x=78 Sample proportion p^=x/n =78/169 =0.4615 NOTE:-…
Q: A set of data items is normally distributed with a mean of 90 and a standard deviation of 4 Convert…
A: Solution
Q: Obstetrics The figure below plots the sampling distribution of the mean from 200 samples of size 8…
A:
Q: Make 1 situation in your community where you can apply hypothesis testing. Answer also the questions…
A: Consider the scenario of the regular playing hours of a children in the community. I want to check…
Q: Suppose you are a product engineer for a tool manufacturing company, and want to investigate the…
A: The number of drill designs is 12 and the number of control groups is 1.
Q: Suppose you work as a manager for a large clothing store. You are considering introducing a loyalty…
A: There are two independent samples which are loyalty program and no loyalty program. We have to find…
Q: n two suppliers. Both distributions pulations are independent. Use a = cts were selected from…
A: According to guidelines we solve first three subparts when given multiple subparts.
Q: ou are the manager of a local cinema, and want to investigate how much the verage customer spends on…
A: We have given that, Average or Sample mean (x̄) = $9.38, sample standard deviation (s) = $2.97 and…
Q: 1. Define quantitative analysis. What are some of the organizations that support the use of the…
A: Quantitative analysis is study of the raw data and numbers where mathematical models are developed…
Q: Do male and female servers at Swank Bar work the same number of hours? A sample of 60 female servers…
A: We have given the following Sample mean 1 = 33 Sample mean 2= 32 n1 =60 n2 = 60 Standard deviation…
Q: consider the normal standard deviation the mean is always------and the standard deviation is always
A: Let Z be the random variable from standard normal distribution with mean = 0 and standard deviation…
Q: You have a one-sided hypothesis test with alpha level 0.05 and p-value of 0.04. Which of the…
A: here use basic of hypothesis testing
Q: An agent for a residential real estate company in a large city has the business objective of…
A: Given: Size Rent 850 1950 1450 2600 1085 2200 1232 2500 718 1950 1485 2700 1136…
Q: 1. A researcher claims that 85% of college students would rather spend their extra money for…
A: Since you have posted a question with multiple sub-parts, we will solve first three subparts for…
Q: The weight of trucks traveling on a particular section of Highway 2H has a population mean of 15.8…
A:
Q: It is known that roughly 2/3 of all human beings have a dominant right foot or eye. Is there also…
A: Given that Sample size n =130 Favorable cases x =80 Sample proportion p^=x/n =80/130 =0.6154
Q: During one shift, the express lane clerk recorded how many times customers violated the "10 items or…
A: The histogram shows the number of items over the limit each violator placed on the conveyor belt.
Q: Suppose you are an educational researcher, and want to investigate the preferences of students for…
A: It is given that sample size (n) is 305 and x is 208.
Q: n(Σxy) - (Σχ)(Σy) VnEx - (Σ] [ nEy? - (Ey}]
A: Given Data is Baby x y A 8 56 B 5 44 C 11 79 D 13 72 E 10 70 F 5 54 G 18 94 H 15…
Q: en, find the probability of selecting a married person. Marital Status, Ages 15 or Older, in…
A: Given Total number of adult men=124 Number of married men=69
Q: Consider the hypotheses below. H0: μ≥60 H1: μ<60 Given that x=55.3, s=6.9, n=25, andα=0.10,…
A:
Q: You are the manager of a local cinema, and want to investigate how much the average customer spends…
A: Given information Sample size (n) = 25 Sample mean x̅ = $11.68 Standard deviation (s) = $2.45…
Q: During one shift, the express lane clerk recorded how many times customers violated the "10 items or…
A:
Q: Please answer both subparts. I will really upvote
A:
Q: A random sample of 85 supervisors revealed that they worked an average of 7.3 years before being…
A:
Q: 4.2.19. Let X₁, X2..... X be a random sample from a gamma distribution with known parameter a = 3…
A:
Calculate the three F-ratios and state a conclusion for each test (indicate if there was an effect or not):
A)
Test 1: F-ratio1 =
Conclusion (effect' or 'no effect'):
B)
Test 2: F-ratio2 =
Conclusion (effect' or 'no effect'):
C)
Test 3: F-ratio3 =
Conclusion (effect' or 'no effect'):

Step by step
Solved in 8 steps with 2 images

- The following data represents results from an experiment comparing 3 treatment conditions for the cure of boredom. Treatment 1 is doing schoolwork, Treatment 2 is watching tv, and Treatment 3 is spending time with friends. The following scores represent treatment effectiveness scores where higher values indicate that the treatment of boredom was effective and lower values indicate that the treatment of boredom was ineffective. Treatment 1 Treatment 2 Treatment 3 0 1 6 N= 12 1 4 5 GM= 3.00 0 1 8 3 2 5…Suppose a researcher is interested inthe effectiveness in a new childhood exercise program implemented in a SRS of schools across a particular county. In order to test the hypothesis that the new program decreases BMI (Kg/m2), the researcher takes a SRS of children from schools where the program is employed and a SRS from schools that do not employ the program and compares the results. Assume the following table represents the SRSs of students and their BMIs. Student intervention group BMI (kg/m2) Student control group BMI (kg/m2) A 18.6 A 21.6 B 18.2 B 18.9 C 19.5 C 19.4 D 18.9 D 22.6 E 24.1 F 23.6 A) Assuming that all the necessary conditions are met (normality, independence, etc.) carry out the appropriate statistical test to determine if the new exercise program is effective. Use an alpha level of 0.05. Do not assume equal variances.B) Construct a 95% confidence interval about your estimate for the average difference in BMI between the groups.The director of an obesity clinic in a large northwestern city believes that drinking soft drinks contribute to obesity in children. To determine whether a relationship exists between these two variables, she conducts the following pilot study. Eight- 12-year-old male volunteers are randomly selected from children attending a local junior high school. Parents of the children are asked to monitor the number of soft drinks consumed by their child over a one week period. The children are weighed at the end of the week and their weights converted into body mass index (BMI) values. The BMI is a common index used to measure obesity and takes into account both height and weight. An individual is considered obese if they have a BMI value 30. The following data or collected: child. # of soft drinks consumed BMI 1 3 20 2 1 18 3…
- A nutritionist compared the effectiveness of an online diet program to that of an inperson diet program. After three months, she compared the number of pounds of weight lost. The control group (in-person) lost a mean of 18.00 pounds (s = 14.50, n = 16) and the experimental group (online) lost 16.00 pounds (s = 13.30, n = 21). Use an alpha of .05, a two-tailed test, s2pooled = 191.19, and sM1−M2 = 4.5 to determine if there is a difference between the two programs.The researchers reported:" A 2x2 ANOVA revealed, first of all, a main effect for depletion, indicating that depleted individuals generated less ideas (M = 9.40, SD = 5.64) than non-depleted individuals (M = 12.44, SD = 7.34), F (1, 108) = 6.03, p = .016, n2 = .05. This effect was qualified by the expected interaction with [perseverance], F (1,108) = 4.52, p = .036, n2 = .05". What size are the effects for the main effect of depletion and for the interaction between depletion and perseverance, according to Cohen's conventions? a. These are small- to -medium effects b. These are non existent effects c. These are large effects d. We are unable to tell from from the n2 / r2 statisticsAn automotive engineer is investigating two different types of metering devices for an electronic fuel injection system to determine whether they differ in their fuel mileage performance. The system is installed on 10 different cars, and a test is run with each metering device on each car. The data is provided below: Metering Device Car 1 2 1 17.6 16.8 2 19.4 20.0 3 18.2 17.6 4 17.1 16.4 5 15.3 16.0 6 15.9 15.9 7 16.3 16.5 8 18.0 18.4 9 17.3 16.4 10 19.1 20.1 Is there a significant difference between the means of the two metering devices? Use . Interpret the result in the context of the problem. An article in the journal Hazardous Waste and Hazardous Materials (Vol. 6, 1989) reported the results of an analysis of the weight of calcium in standard cement and cement doped with lead. Reduced levels of calcium would indicate that the hydration mechanism in the cement is blocked…
- A U.S. study published in The American Journal of Preventive Medicine compared state-level prevalence of firearm ownership in 2002 with state-level rates of firearm assault and firearm robbery in the subsequent year. The investigators found a positive association - meaning that states with higher prevalence of firearm ownership also tended to be the states with higher rates of firearm assault. Which design best describes this study? a)Observational cohort study b)Randomized trial c)Case-control study d)Ecological studyA regional distributor of NIKE shoes is in the process of analyzing the factors that influence thedemand for the NIKE brand. The distributor hired an economist to conduct a study on the demand for this product. The economist collected quarterly time series data from 1986Q1 to 1991Q4 on the following variables:SALES Sales of NIKE shoesRPDI Real personal disposal incomeCONF Consumer confidence indexD2 Dummy variable for quarter 2D3 Dummy variable for quarter 3D4 Dummy variable for quarter 4Ordinary Least Squares was applied using sales as the dependent variable and real personal disposal income, consumer confidence index, dummy variable for quarter 2, dummy variable for quarter 3, and dummy variable for quarter 4 as independent variables. The table below shows the OLS output.Model 1: OLS, using observations 1986:1-1991:4 (T = 24)Dependent variable: SALESCoefficient Std. Error t-ratio p-valueconst −139.452 61.8421 −2.255 0.0368 **RPDI 1.56286 0.438492 3.564 0.0022 ***CONF 0.256247…A regional distributor of NIKE shoes is in the process of analyzing the factors that influence thedemand for the NIKE brand. The distributor hired an economist to conduct a study on the demand for this product. The economist collected quarterly time series data from 1986Q1 to 1991Q4 on the following variables:SALES Sales of NIKE shoesRPDI Real personal disposal incomeCONF Consumer confidence indexD2 Dummy variable for quarter 2D3 Dummy variable for quarter 3D4 Dummy variable for quarter 4Ordinary Least Squares was applied using sales as the dependent variable and real personal disposal income, consumer confidence index, dummy variable for quarter 2, dummy variable for quarter 3, and dummy variable for quarter 4 as independent variables. The table below shows the OLS output.Model 1: OLS, using observations 1986:1-1991:4 (T = 24)Dependent variable: SALESCoefficient Std. Error t-ratio p-valueconst −139.452 61.8421 −2.255 0.0368 **RPDI 1.56286 0.438492 3.564 0.0022 ***CONF 0.256247…
- for an experiment involving 3 levels of factor A and 3 levels of factor B with a sample of n=8 in each treatment condition, what are the df values for the F-factor for the A * B (A multiplied by B) interaction?Consider the following 2 × 2 table from a hypothetical cohort study. Calculate the relative risk of CVD comparing those with high fasting glucose (≥126 mg/dL) with those with normal fasting glucose (<126 mg/dL) Serum fasting glucose Developed CVD Did not develop CVD Total ≥126 mg/dL (exposed) 125 325 450 <126 mg/dL (not exposed) 50 500 550 Total 175 825 1000 Group of answer choices 0.33 0.75 1.02 3.08 5.34A double-blind randomized experiment compared the effects of the drug Lorcaserin and a placebo on weight loss in overweight adults. All subjects were also required to undergo diet and exercise counseling. The study involved 1000 participants where half of them would take Lorcaserin and half the placebo. The researchers found that after a year the treatment group had an average weight loss of 5.8 kg while the placebo group had an average weight loss of 3.9 carmona, kg. Based on this information researchers need to decide if Locarserin can be a possible treatment for weight loss. a. What would be a Type I error in this context? Your answer should consist of both the researchers’ decision and what the reality is. b. What would be a Type II error in this context? Your answer should consist of both the researchers’ decision and what the reality is.