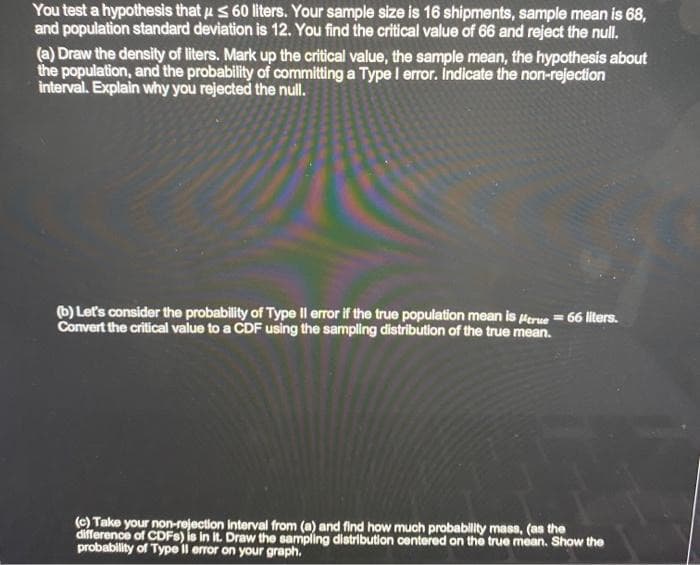
You test a hypothesis that μ S 60 liters. Your sample size is 16 shipments, sample mean is 68, and population standard deviation is 12. You find the critical value of 66 and reject the null. (a) Draw the density of liters. Mark up the critical value, the sample mean, the hypothesis about the population, and the probability of committing a Type I error. Indicate the non-rejection interval. Explain why you rejected the null. (b) Let's consider the probability of Type Il error if the true population mean is true = 66 liters. Convert the critical value to a CDF using the sampling distribution of the true mean. (c) Take your non-rejection Interval from (a) and find how much probability mass, (as the difference of CDFs) is in it. Draw the sampling distribution centered on the true mean. Show the probability of Type Il error on your graph.
You test a hypothesis that μ S 60 liters. Your sample size is 16 shipments, sample mean is 68, and population standard deviation is 12. You find the critical value of 66 and reject the null. (a) Draw the density of liters. Mark up the critical value, the sample mean, the hypothesis about the population, and the probability of committing a Type I error. Indicate the non-rejection interval. Explain why you rejected the null. (b) Let's consider the probability of Type Il error if the true population mean is true = 66 liters. Convert the critical value to a CDF using the sampling distribution of the true mean. (c) Take your non-rejection Interval from (a) and find how much probability mass, (as the difference of CDFs) is in it. Draw the sampling distribution centered on the true mean. Show the probability of Type Il error on your graph.

MATLAB: An Introduction with Applications
6th Edition
ISBN:9781119256830
Author:Amos Gilat
Publisher:Amos Gilat
Chapter1: Starting With Matlab
Section: Chapter Questions
Problem 1P

Related questions
Question
Transcribed Image Text:You test a hypothesis that us 60 liters. Your sample size is 16 shipments, sample mean is 68,
and population standard deviation is 12. You find the critical value of 66 and reject the null.
(a) Draw the density of liters. Mark up the critical value, the sample mean, the hypothesis about
the population, and the probability of committing a Type I error. Indicate the non-rejection
interval. Explain why you rejected the null.
(b) Let's consider the probability of Type Il error if the true population mean is true = 66 liters.
Convert the critical value to a CDF using the sampling distribution of the true mean.
(c) Take your non-rejection interval from (a) and find how much probability mass, (as the
difference of CDFs) is in it. Draw the sampling distribution centered on the true mean. Show the
probability of Type Il error on your graph.
Expert Solution
This question has been solved!
Explore an expertly crafted, step-by-step solution for a thorough understanding of key concepts.

Step by step
Solved in 5 steps with 2 images

Recommended textbooks for you
MATLAB: An Introduction with Applications
Statistics
ISBN:
9781119256830
Author:
Amos Gilat
Publisher:
John Wiley & Sons Inc

Probability and Statistics for Engineering and th…
Statistics
ISBN:
9781305251809
Author:
Jay L. Devore
Publisher:
Cengage Learning

Statistics for The Behavioral Sciences (MindTap C…
Statistics
ISBN:
9781305504912
Author:
Frederick J Gravetter, Larry B. Wallnau
Publisher:
Cengage Learning
MATLAB: An Introduction with Applications
Statistics
ISBN:
9781119256830
Author:
Amos Gilat
Publisher:
John Wiley & Sons Inc
Probability and Statistics for Engineering and th…
Statistics
ISBN:
9781305251809
Author:
Jay L. Devore
Publisher:
Cengage Learning
Statistics for The Behavioral Sciences (MindTap C…
Statistics
ISBN:
9781305504912
Author:
Frederick J Gravetter, Larry B. Wallnau
Publisher:
Cengage Learning

Elementary Statistics: Picturing the World (7th E…
Statistics
ISBN:
9780134683416
Author:
Ron Larson, Betsy Farber
Publisher:
PEARSON

The Basic Practice of Statistics
Statistics
ISBN:
9781319042578
Author:
David S. Moore, William I. Notz, Michael A. Fligner
Publisher:
W. H. Freeman

Introduction to the Practice of Statistics
Statistics
ISBN:
9781319013387
Author:
David S. Moore, George P. McCabe, Bruce A. Craig
Publisher:
W. H. Freeman