allon) $2.20 $2.00 $1.80 $1.60 $1.40 $1.20 $1.00 D i. 300 400 500 600 700 800 Quantity of Gasoline (millions of gallons) ii. ($2.20 per gallon, 420 million gallons) ($2.00 per gallon, 460 million gallons) ($1.80 per gallon, 500 million gallons) ($1.60 per gallon, 550 million gallons) ($1.40 per gallon, 600 million gallons) ($1.20 per gallon, 700 million gallons) ($1.00 per gallon, 800 million gallons) iii. 900 Price ($ per gallon) $2.20 $2.00 $1.80 $1.60 $1.40 $1.20 $1.00 ($2.20 per gallon, 720 million gallons) ($2.00 per gallon, 700 million gallons) ($1.80 per gallon, 680 million gallons) ($1.60 per gallon, 640 million gallons) ($1.40 per gallon, 600 million gallons) ($1.20 per gallon, 550 million gallons) ($1.00 per gallon, 500 million gallons) 300 400 500 600 700 800 900 Quantity of Gasoline (millions of gallons) Graph both the demand and supply curve together and identify the equilibrium price and quantity. Define what an equilibrium represents. How do you know if a market is in equilibrium? Provide an example. Graph both the demand and supply curve together. Graph and identify the impact of a price ceiling of $2.00. Explain what will happen to gasoline in this market.
allon) $2.20 $2.00 $1.80 $1.60 $1.40 $1.20 $1.00 D i. 300 400 500 600 700 800 Quantity of Gasoline (millions of gallons) ii. ($2.20 per gallon, 420 million gallons) ($2.00 per gallon, 460 million gallons) ($1.80 per gallon, 500 million gallons) ($1.60 per gallon, 550 million gallons) ($1.40 per gallon, 600 million gallons) ($1.20 per gallon, 700 million gallons) ($1.00 per gallon, 800 million gallons) iii. 900 Price ($ per gallon) $2.20 $2.00 $1.80 $1.60 $1.40 $1.20 $1.00 ($2.20 per gallon, 720 million gallons) ($2.00 per gallon, 700 million gallons) ($1.80 per gallon, 680 million gallons) ($1.60 per gallon, 640 million gallons) ($1.40 per gallon, 600 million gallons) ($1.20 per gallon, 550 million gallons) ($1.00 per gallon, 500 million gallons) 300 400 500 600 700 800 900 Quantity of Gasoline (millions of gallons) Graph both the demand and supply curve together and identify the equilibrium price and quantity. Define what an equilibrium represents. How do you know if a market is in equilibrium? Provide an example. Graph both the demand and supply curve together. Graph and identify the impact of a price ceiling of $2.00. Explain what will happen to gasoline in this market.

Chapter1: Making Economics Decisions
Section: Chapter Questions
Problem 1QTC

Related questions
Question
Transcribed Image Text:Price ($ per gallon)
$2.20
$2.00
$1.80
$1.60-
$1.40-
$1.20-
$1.00-
D
i.
300 400 500 600
700 800
Quantity of Gasoline (millions of gallons)
ii.
iii.
iv.
V.
vi.
vii.
viii.
ix.
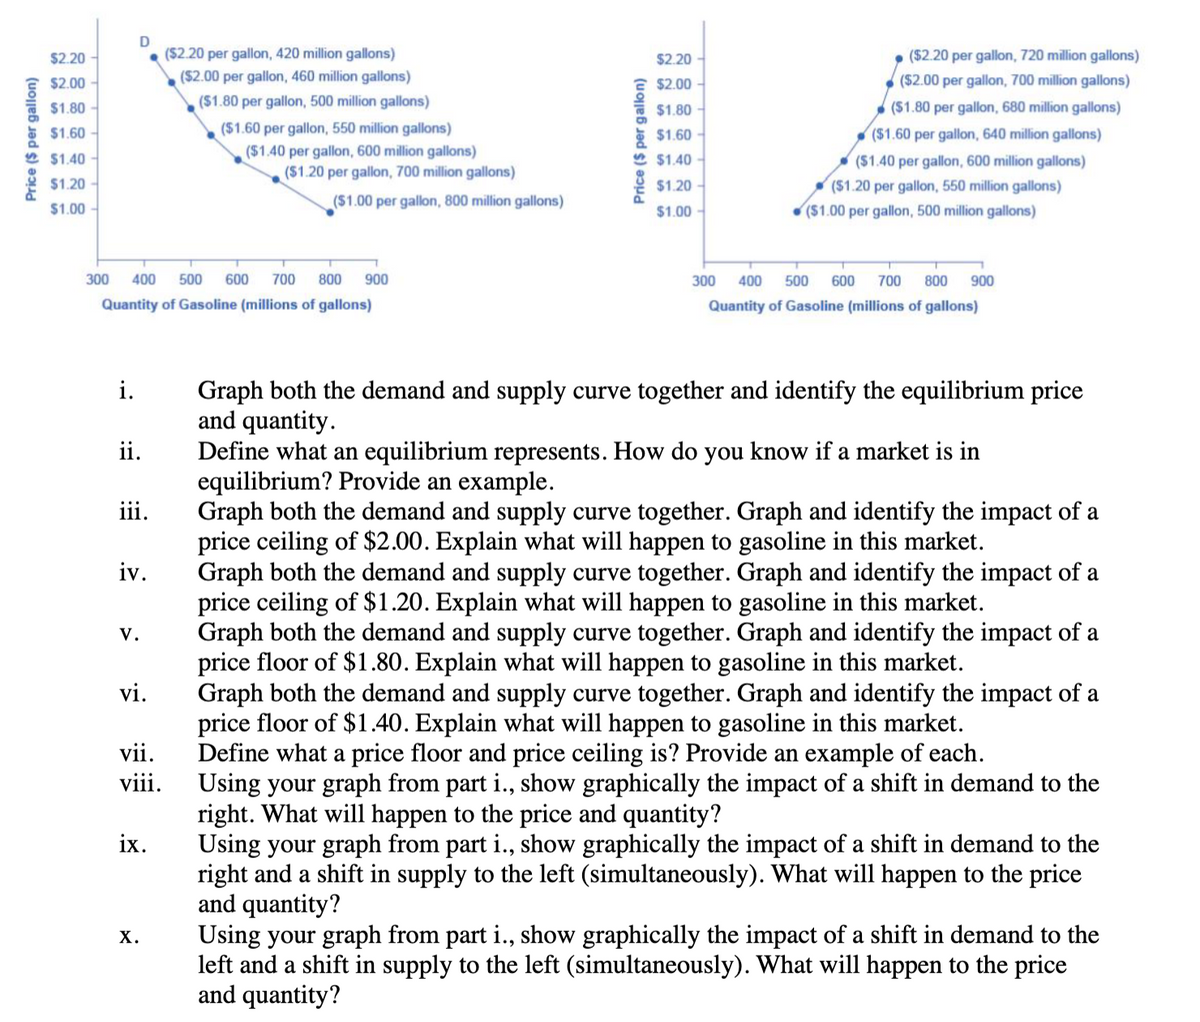
($2.20 per gallon, 420 million gallons)
($2.00 per gallon, 460 million gallons)
($1.80 per gallon, 500 million gallons)
($1.60 per gallon, 550 million gallons)
($1.40 per gallon, 600 million gallons)
($1.20 per gallon, 700 million gallons)
X.
($1.00 per gallon, 800 million gallons)
900
Price ($ per gallon)
$2.20
$2.00
$1.80
$1.60-
$1.40-
$1.20-
$1.00-
($2.20 per gallon, 720 million gallons)
($2.00 per gallon, 700 million gallons)
($1.80 per gallon, 680 million gallons)
($1.60 per gallon, 640 million gallons)
($1.40 per gallon, 600 million gallons)
($1.20 per gallon, 550 million gallons)
($1.00 per gallon, 500 million gallons)
300
400 500 600 700 800 900
Quantity of Gasoline (millions of gallons)
Graph both the demand and supply curve together and identify the equilibrium price
and quantity.
Define what an equilibrium represents. How do you know if a market is in
equilibrium? Provide an example.
Graph both the demand and supply curve together. Graph and identify the impact of a
price ceiling of $2.00. Explain what will happen to gasoline in this market.
Graph both the demand and supply curve together. Graph and identify the impact of a
price ceiling of $1.20. Explain what will happen to gasoline in this market.
Graph both the demand and supply curve together. Graph and identify the impact of a
price floor of $1.80. Explain what will happen to gasoline in this market.
Graph both the demand and supply curve together. Graph and identify the impact of a
price floor of $1.40. Explain what will happen to gasoline in this market.
Define what a price floor and price ceiling is? Provide an example of each.
Using your graph from part i., show graphically the impact of a shift in demand to the
right. What will happen to the price and quantity?
Using your graph from part i., show graphically the impact of a shift in demand to the
right and a shift in supply to the left (simultaneously). What will happen to the price
and quantity?
Using your graph from part i., show graphically the impact of a shift in demand to the
left and a shift in supply to the left (simultaneously). What will happen to the price
and quantity?
Expert Solution
This question has been solved!
Explore an expertly crafted, step-by-step solution for a thorough understanding of key concepts.

This is a popular solution!

Trending now
This is a popular solution!

Step by step
Solved in 4 steps with 2 images

Knowledge Booster


Learn more about
Need a deep-dive on the concept behind this application? Look no further. Learn more about this topic, economics and related others by exploring similar questions and additional content below.Recommended textbooks for you

Principles of Economics (12th Edition)
Economics
ISBN:
9780134078779
Author:
Karl E. Case, Ray C. Fair, Sharon E. Oster
Publisher:
PEARSON

Engineering Economy (17th Edition)
Economics
ISBN:
9780134870069
Author:
William G. Sullivan, Elin M. Wicks, C. Patrick Koelling
Publisher:
PEARSON
Principles of Economics (12th Edition)
Economics
ISBN:
9780134078779
Author:
Karl E. Case, Ray C. Fair, Sharon E. Oster
Publisher:
PEARSON
Engineering Economy (17th Edition)
Economics
ISBN:
9780134870069
Author:
William G. Sullivan, Elin M. Wicks, C. Patrick Koelling
Publisher:
PEARSON

Principles of Economics (MindTap Course List)
Economics
ISBN:
9781305585126
Author:
N. Gregory Mankiw
Publisher:
Cengage Learning

Managerial Economics: A Problem Solving Approach
Economics
ISBN:
9781337106665
Author:
Luke M. Froeb, Brian T. McCann, Michael R. Ward, Mike Shor
Publisher:
Cengage Learning

Managerial Economics & Business Strategy (Mcgraw-…
Economics
ISBN:
9781259290619
Author:
Michael Baye, Jeff Prince
Publisher:
McGraw-Hill Education