(also known as the production possibilities curve) for alfalfa, an agricultural good, and cars, a capital good. Drag the production possibilities curve (PPC) on the graph to show the effects of an agricultural innovation that increases the crop yield of each hectare of land. Note: Select either end of the curve on the graph to make the endpoints appear. Then drag one or both endpoints to the desired position. Points will snap into position, so if you try to move a point and it snaps back to its original position, just drag it a little farther. (? 540 450 PPC 360 270 O 180 90 PPC 50 100 150 200 250 300 ALFALFA (Millions of bushels) CARS (Thousands)
(also known as the production possibilities curve) for alfalfa, an agricultural good, and cars, a capital good. Drag the production possibilities curve (PPC) on the graph to show the effects of an agricultural innovation that increases the crop yield of each hectare of land. Note: Select either end of the curve on the graph to make the endpoints appear. Then drag one or both endpoints to the desired position. Points will snap into position, so if you try to move a point and it snaps back to its original position, just drag it a little farther. (? 540 450 PPC 360 270 O 180 90 PPC 50 100 150 200 250 300 ALFALFA (Millions of bushels) CARS (Thousands)

Chapter2: Productions Possibilities, Opportunity Costs, And Economic Growth
Section: Chapter Questions
Problem 14SQ

Related questions
Question
100%
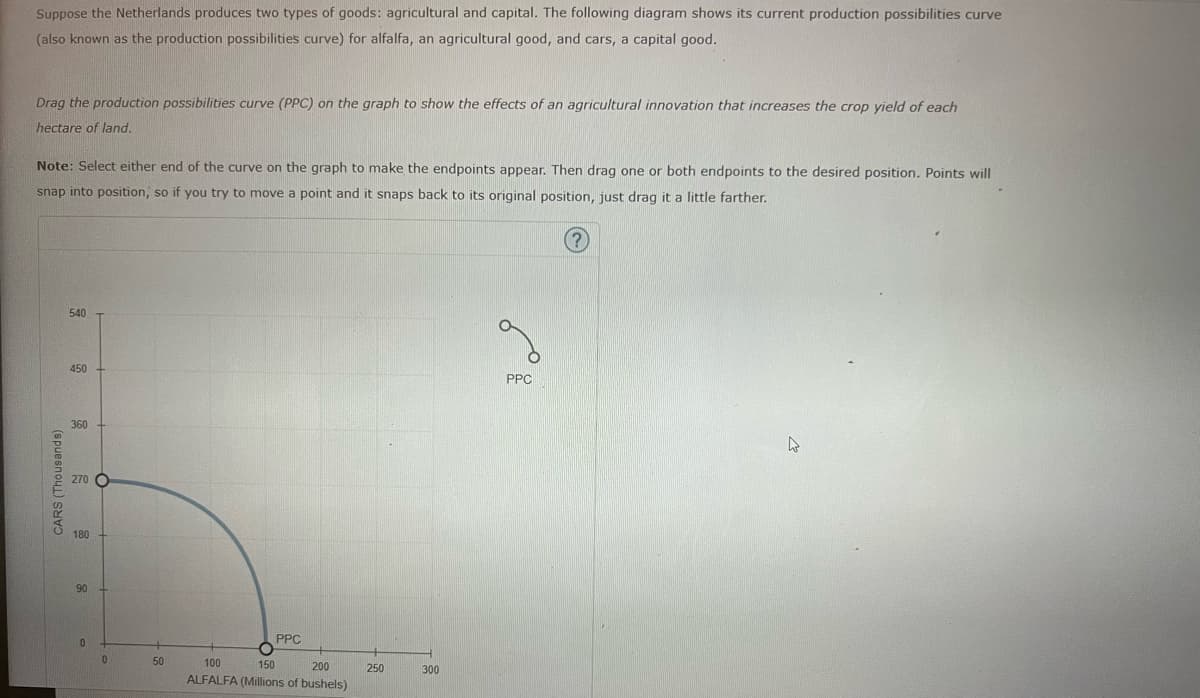
Transcribed Image Text:Suppose the Netherlands produces two types of goods: agricultural and capital. The following diagram shows its current production possibilities curve
(also known as the production possibilities curve) for alfalfa, an agricultural good, and cars, a capital good.
Drag the production possibilities curve (PPC) on the graph to show the effects of an agricultural innovation that increases the crop yield of each
hectare of land.
Note: Select either end of the curve on the graph to make the endpoints appear. Then drag one or both endpoints to the desired position. Points will
snap into position, so if you try to move a point and it snaps back to its original position, just drag it a little farther.
(?
540
450
PPC
360
270 O
180
90
PPC
50
100
150
200
250
300
ALFALFA (Millions of bushels)
CARS (Thousands)
Expert Solution
This question has been solved!
Explore an expertly crafted, step-by-step solution for a thorough understanding of key concepts.

This is a popular solution!

Trending now
This is a popular solution!

Step by step
Solved in 2 steps with 1 images

Knowledge Booster


Learn more about
Need a deep-dive on the concept behind this application? Look no further. Learn more about this topic, economics and related others by exploring similar questions and additional content below.Recommended textbooks for you


Survey of Economics (MindTap Course List)
Economics
ISBN:
9781305260948
Author:
Irvin B. Tucker
Publisher:
Cengage Learning

Economics (MindTap Course List)
Economics
ISBN:
9781337617383
Author:
Roger A. Arnold
Publisher:
Cengage Learning