alue 0.10 0.05 p-value < 0.10 0.025 p-value < 0.05 0.01 p-value < 0.025 p-value < 0.01
alue 0.10 0.05 p-value < 0.10 0.025 p-value < 0.05 0.01 p-value < 0.025 p-value < 0.01

Glencoe Algebra 1, Student Edition, 9780079039897, 0079039898, 2018
18th Edition
ISBN:9780079039897
Author:Carter
Publisher:Carter
Chapter10: Statistics
Section10.3: Measures Of Spread
Problem 1GP

Related questions
Question
e2 Find the p-value.
multiple choice 2
-
p-value 0.10
-
0.05 p-value < 0.10
-
0.025 p-value < 0.05
-
0.01 p-value < 0.025
-
p-value < 0.01
f. At the 10% significance level, what is the conclusion to the test?
multiple choice 3
-
Do not reject H0 since the p-value is not less than significance level.
-
Reject H0 since the p-value is less than significance level.
-
Reject H0 since the p-value is not less than significance level.
-
Do not reject H0 since the p-value is less than significance level.
g. Interpret the results at αα = 0.10.
multiple choice 4
-
We conclude that some means differ.
-
We cannot conclude that some means differ.
-
We cannot conclude that all means differ.
-
We cannot conclude that population
mean C is greater than population mean A.
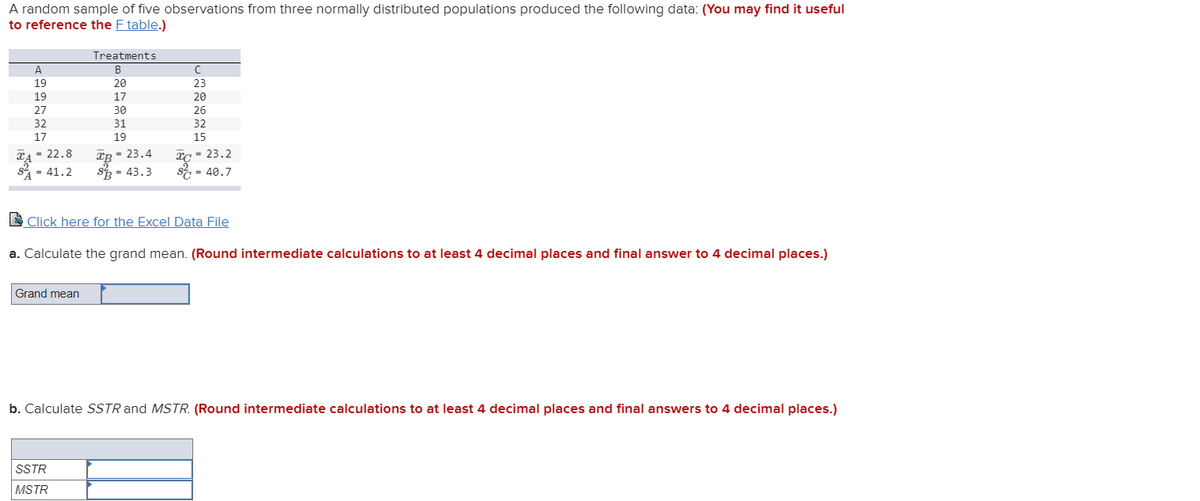
Transcribed Image Text:A random sample of five observations from three normally distributed populations produced the following data: (You may find it useful
to reference the F table.)
Treatments
A
В
19
20
23
19
17
20
27
30
26
32
31
32
17
19
15
TA = 22.8
S1= 41.2
Гв - 23.4
S = 43.3
Xc = 23.2
SE = 40.7
S Click here for the Excel Data File
a. Calculate the grand mean. (Round intermediate calculations to at least 4 decimal places and final answer to 4 decimal places.)
Grand mean
b. Calculate SSTR and MSTR. (Round intermediate calculations to at least 4 decimal places and final answers to 4 decimal places.)
SSTR
MSTR
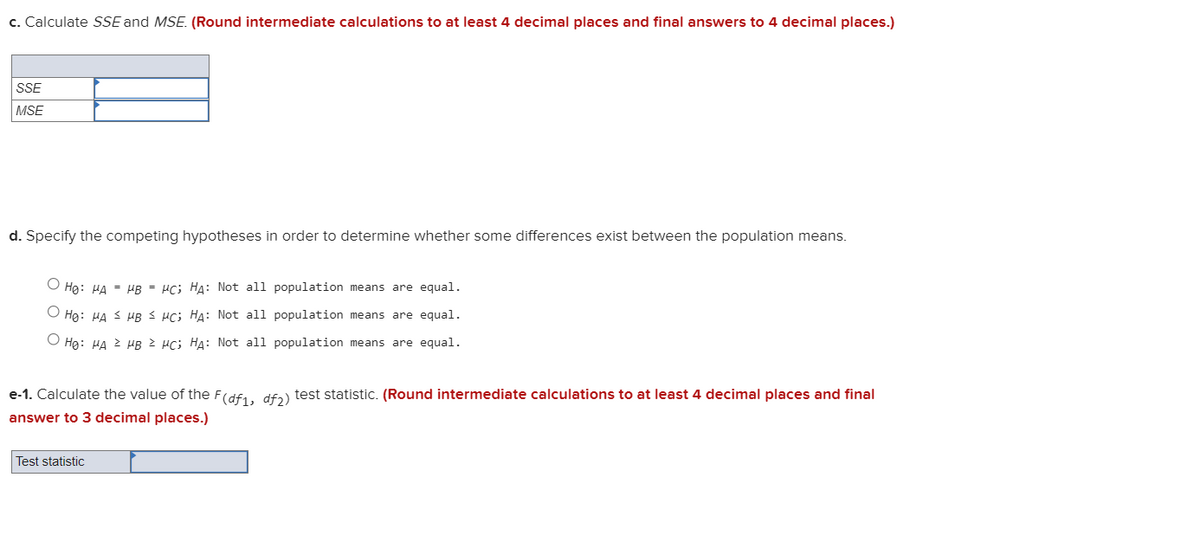
Transcribed Image Text:c. Calculate SSE and MSE. (Round intermediate calculations to at least 4 decimal places and final answers to 4 decimal places.)
SSE
MSE
d. Specify the competing hypotheses in order to determine whether some differences exist between the population means.
Hg: HA = HB = µc; HA: Not all population means are equal.
Hg: HA 3 HB S Hc; HA: Not all population means are equal.
Hg: HA 2 HB µc; HA: Not all population means are equal.
e-1. Calculate the value of the F(df1, dfɔ) test statistic. (Round intermediate calculations to at least 4 decimal places and final
answer to 3 decimal places.)
Test statistic
Expert Solution
This question has been solved!
Explore an expertly crafted, step-by-step solution for a thorough understanding of key concepts.

Step by step
Solved in 2 steps with 3 images

Recommended textbooks for you
Glencoe Algebra 1, Student Edition, 9780079039897…
Algebra
ISBN:
9780079039897
Author:
Carter
Publisher:
McGraw Hill
Glencoe Algebra 1, Student Edition, 9780079039897…
Algebra
ISBN:
9780079039897
Author:
Carter
Publisher:
McGraw Hill