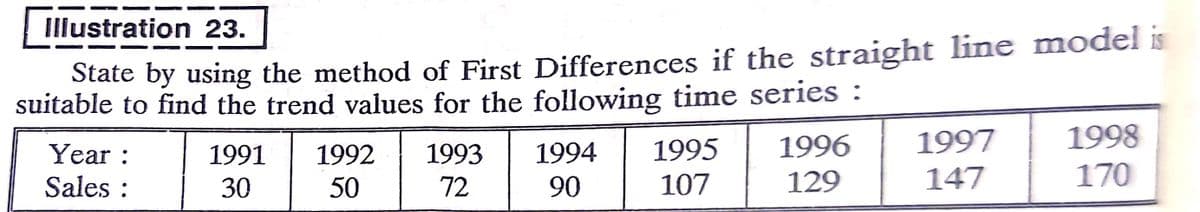
Illustration 23. State by using the method of First Differences if the straight line model is suitable to find the trend values for the following time series : 1998 170 1997 Year : Sales : 1995 107 1996 129 1991 1992 1993 1994 30 50 72 90 147


Q: Given the equation of a regression line is y= -1.5x-1.8, what is the best predicted value for y…
A:
Q: Find the (a) mean, (b) median, (c) mode, and (d) midrange for the data and then (e) answer the given…
A: We have given that the data of the jersey numbers of 11 players randomly selected from the roaster…
Q: Learner Height (in meter) Consider the heights of 5 learners. Suppose you are interested in…
A: Solution: Given data
Q: e. Find the 75th percentile of the data set. Your answer f. Interpret (e). Your answer g. How many…
A: Data :…
Q: When we add a statistically significant interaction term between the independent variables x1 and x2…
A: Interaction Effect: The interaction effect occurs when one variable depends upon the value of…
Q: A lock on a bank vault consists of three dials, each with 30 positions. In order for the vault to…
A: Given : A lock on a bank vault consists of three dials, each with 30 positions. In order for the…
Q: Let X and Y be two continuous random variables with joint probability density function. 12 ... f(x,…
A:
Q: Use the multiple regression equation given below to predict the y-value for the given values of the…
A: We have given that the regression line of the two variables X and Y is y = 9.876 + 0.173x1 + 0.051x2
Q: Data Management - Organization of Data for Analysis What are the types of data from the statements…
A: Data types are vital to statistical analysis as all inferential statistics assume a specific data…
Q: The following data represents the winning percentage (the number of wins out of 162 games in a…
A: The independent variable is Earned Run Average. The dependent variable is Winning Proportion. We…
Q: Compute the standard deviation for the following sample data. Provide answer up to 3 decima its…
A: Consider, x¯=32+41+63+24+29+30+40+22+25+3710 =34.3
Q: Sixty-three percent of U.S. households have a personal computer. In a random sample of 400…
A: Let p be the proportion of households have a personal computer. Given that p = 0.63 Let X denote the…
Q: The minimum wage earners of the National Capital Region are believed to be receiving les: than Php…
A: Hypothesis testing is vital to inferential statistics.
Q: The distribution of scores on a standardized aptitude test is approximately normal with a mean of…
A:
Q: 7. D, = D =. Class Intervals 0-6 1 7-13 6. 14-20 4 21-27 14 28-34 24 35-41 16 42-48 11 49-55 56-62…
A: For the given data D2 = ? D8 = ?
Q: Ilustration 17.11. You are given below a frequency distribution. Fit a normal curve to the data. Mid…
A:
Q: 13. Systematic random sampling is used to interview 10% of the students at a local school with 1950…
A:
Q: The standard error of the mean for a sample size of 10 is enter your response here. (Round to two…
A:
Q: From the following series of cyclical fluctuations find the 3-yearly, 5-ycarly, 7-yearly and…
A:
Q: Which is true about the standard normal curve?
A: here use basic of normal curve
Q: B. Find the indicated decile. 75, 78, 73, 71, 59, 64, 74, 56, 61, 71, 59, 64, 75, 78, 73, 74, 56, 61…
A:
Q: When can binomial distribution be well approximated by Poisson distribution? What is the…
A: Let there are n trials and each having two outcomes - Success and Failure. The trials are…
Q: Three different types of material can be used in a particular building process. The resulting yield…
A: Null Hypothesis: H0: The three populations have equal means. Alternative Hypothesis: H1: At least…
Q: Let x be a normal random variable with a mean of 30 and a standard deviation of 4. Determine…
A: Let x be a normal random variable with a mean of 30 and a standard deviation of 4. Determine…
Q: HA = 0.321 (Round to three decimal places as needed.) Determine the standard deviation of the…
A: Solution-: Given: N=30000,n=1200,p=0.321 We find, (a) μp^=? (b) σp^=?
Q: Consider a regression model: t = 1,2, ..,T Yt = Bo + B1x1t +U; u = pu,-1 + vi where v,~iid(0, o?).…
A:
Q: What is the area of the shaded region in the curve? -1 1 2 3 a. 0.7745 b. 0.4332 c. 0.8413 d. 0.3413
A: Here shaded area P(z=1)-p(z= -1.5) Now probability p(1 <x< -1.5) Using Excel Function…
Q: YMBakery, the daily demand for bread is 100 loaves with probability 0.2, 120 loaves with probability…
A: Since the number of bread loaves (in dozens) purchased is under control of the decision-maker,…
Q: It's true — sand dunes in Colorado rival sand dunes of the Great Sahara Desert! The highest dunes at…
A: Mean(µ) = 13Standard deviations (σ) = 4.1X ~ N (µ, σ )= N(13, 4.1) For, n = 7 x̅ ~ N(nµ, σ√n ) =…
Q: a. What is the distribution of X? X - N( b. Find the probability that a randomly selected Private…
A: HERE GIVEN, mean = 26477$ standard deviation = 6561$ here X= the cost for randomly selected college…
Q: A sample of 250 workers aged 16 and older produced an average length of time with the current…
A: Given,sample size(n)=250sample mean(x¯)=4.4standard deviation(s)=3.8degrees of…
Q: Which calculator function should be used to perform a hypothesis test for a population mean where…
A: Which calculator function should be used to perform a hypothesis test for a population mean where…
Q: Interpret the following cluster analysis data collected by people thinking of starting a nonprofit…
A: Researchers gathered factor analysis data in preparation for the establishment of a nonprofit…
Q: The Blacktop Speedway is a supplier of automotive parts. Included in stock are 6 speedometers that…
A: Given Sample size (n)=3 Population (N)=8 Success size (k)=2
Q: Assume that a sample is used to estimate a population proportion p. Find the margin of error M. E.…
A: Given Sample size n=644, sample standard deviations s=7.6, level of significance=0.002, sample mean…
Q: Determine the degree of freedom, right tailed area, t value Percentile - (4) n - (5) df - 28 Right…
A: Given that df=28 , Right-tailed area=0.10 Find the n , percentile, tcrit
Q: A population having normal distribution with mean of 50 and a standard deviation of 10. If a random…
A:
Q: The accompanying table shows the height (in inches) of 8 high sch Click here to view the data table.…
A: Given, r= -0.049
Q: You are given the following for cohort of VA GLWB contracts aged 65: • Beginning of year contracts…
A: Given Beginning of year contracts in force : 1500 Deaths…
Q: 3. A researcher estimates that the average height of buildings in terms of the number of storey in…
A: In hypothesis testing, the value of the test statistic is calculated from the sample observations.…
Q: Describe the sampling distribution of p. Assume the size of the population is 30,000. n= 1200, p=…
A:
Q: Graph C Graph y y 9500 9500 9000 9000- 8500 8500- 8000 8000 - 7500 7500 - 7000 7000 - 6500 6500-…
A: We have given that the data represent tha ages of the drivers and the number of accidents reported…
Q: If n=28, a(x-bar)=36, and s=17, construct a confidence interval at a 98% confidence level. Assume…
A:
Q: c. Who is the winning Presidential Candidate in the company? CANDIDATE A CANDIDATE B CANDIDATE C…
A: Given problem Given that Taking a survey from all of their 150 employees. d) How many…
Q: 2. Suppose that light is passing through an aqueous copper solution (copper solute dissolved in…
A: We represents the data in column form. Here X represents concentration which is independent…
Q: A sample mean, sample standard deviation, and sample size are given. Use the one-mean t-test to…
A:
Q: What do you think is the reason why history changes
A: Historical change refers to how events change over time. Explore history as a science, discover the…
Q: For the general population, the average fatigue level is μ = 50. A researcher is testing the…
A: From the provided information, Sample size (n) = 30 Sample mean (M) = 46 Sample variance (s2) = 100
Q: Refer to the following distribution of ages. Ages 40 up to 50 se up to 60 Frequency 10 28 60 up to…
A: For the given data Find Relative frequency for lowest class = ?
Q: The test statistics is
A: We have given that Sample mean = 7.1 Sample standard deviation s = 2.3 Sample size n = 18 α = 0.01…

Step by step
Solved in 2 steps with 2 images

- Table 4 gives the population of a town (in thousand) from 2000 to 2008. What was the average rate of change of population (a) between 2002 and 2004, and (b) between 2002 and 2006?The US. import of wine (in hectoliters) for several years is given in Table 5. Determine whether the trend appearslinear. Ifso, and assuming the trend continues, in what year will imports exceed 12,000 hectoliters?The following chart shows "living wage" jobs in Rochester per 1000 working age adults over a 5 year period. Year 1997 1998 1999 2000 2001 Jobs 630 680 715 745 770 What is the average rate of change in the number of living wage jobs from 1997 to 1999?--------- Jobs/YearWhat is the average rate of change in the number of living wage jobs from 1999 to 2001?---------- Jobs/Year
- For the hawkins company, the monthly percentages of all shipments received on timeover the past 12 months are 80, 82, 84, 83, 83, 84, 85, 84, 82, 83, 84, and 83.a. construct a time series plot. What type of pattern exists in the data?John Kittle, an independent insurance agent, uses a five-year moving average to forecast the number of claims made in a single year for one of the large insurance companies he sells for. He has just discovered that a clerk in his employ incorrectly entered the number of claims made four years ago as 1,400 when it should have been 1,200.a. What adjustment should Mr. Kittle make in next year’s forecast to take into account the corrected value of the number of claims four years ago?b. Suppose that Mr. Kittle used simple exponential smoothing with a = .2instead of moving averages to determine his forecast. What adjustment is now required in next year’s forecast? (Note that you do not need to know the value of the forecast for next year in order to solve this problem.)The following graph shows a rough approximation of historical and projected median home prices for a country for the period 2000-2024. (Fill in blanks)
- The following ratio-to-moving averages for the seasonally adjusted series were found by the decomposition method applied on a time series representing quarterly sales for January 2018 to December 2020 period: a. Calculate the Seasonal Index for every quarter. b. If the trend is described by the trend line T^ = 1,000 + 30 t, what is the forecast for the fourth quarter of 2021?If we assume the linear trend existed before 1950 and continues after 2000, the states median house values will be (or were) equal in what year?Suppose the following table shows the approximate price of a certain stock in December of each year from 2005 through 2014, as well as the 4-year moving averages for 2005 through 2007.† Complete the table by computing the remaining 4-year moving averages. (Note the peak in 2007 and the drop in subsequent years.) Round each average to the nearest dollar. (Chart in picture)
- Suppose the following table shows the approximate price of a certain stock in December of each year from 2005 through 2014, as well as the 4-year moving averages for 2005 through 2007.† Complete the table by computing the remaining 4-year moving averages. (Note the peak in 2007 and the drop in subsequent years.) Round each average to the nearest dollar.Please answer the following questions using the images provided for data in the images. 1. Which of the following time periods will have the largest annual average increase in the percentage of jobs that could be fully automated (based on the provided images attached)? A) 2020-2028 B) 2028-2030 C) 2030-2035 D) 2035-2040 E) 2040-2050 2. What is the ratio of the total jobs at risk in Transportation and Storage to those at riks in Retail? A) 4.68:7.79 B) 7.79:4.68 C) 52:41 D) 9:19 E) 30:27 3. Salaries in Finance and Insurance are twice as much as the average salary. What is the total amount spent on Finance and Insurance salaries in Switzerland per year (based only on the provided information and images)? 4. What timescale is the title of the grapth (image attached) most likely to be referring to when it says the future? A) 2080 B) 2050 C) 2030 D) 2028 E) 2020 5. Which of the following is the largest number of jobs that could theoretically be within the software industry at…Use the most accurate method to forecast the revenues of licenses, permits, and fees in Years 9, 10, and 11. Use the Year 8 actual figure instead of the forecast figure (Year 8 was $23,210,218). Also, consider three incremental changes in forecasting.