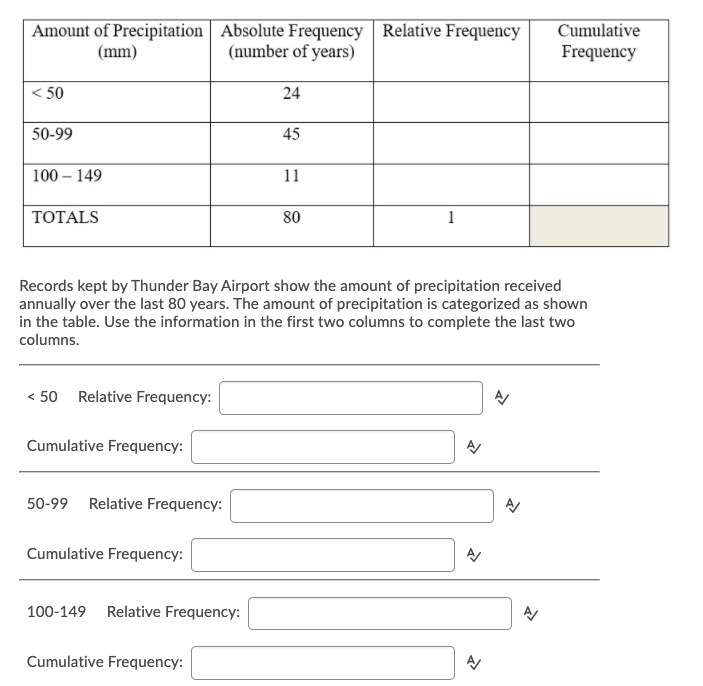
Amount of Precipitation Absolute Frequency | Relative Frequency (number of years) Cumulative Frequency (mm) < 50 24 45 50-99 100 – 149 11 80 1 TOTALS
Q: Class Interval Frequency 1-5 3 6 - 10 4 11 - 15 9 16 - 20 21 - 30 4
A: an ogive, also known as a cumulative frequency polygon is a type of frequency polygon that shows…
Q: The variable age has the Select one: O a. ratio scale of measurement O b. ordinal scale of…
A: Age is classified as an object
Q: quality control analyst wants to build statistical quality control chart for weight of TV with the…
A: Given : n = 8 Average range = 6 Sample of sample means = 107
Q: uestion 9 Given the histogram of percentage of cotton in material used to manufacture men's shirt.…
A:
Q: est Scores Find the percentile rank for each test score in the data set. Round to the nearest whole…
A: Since you have posted multiple sub-parts, we will solve the first three sub-parts for you. To get…
Q: 43. Water Flow A tank holds 1000 gal of water, which drains from the bottom of the tank in half an…
A: Average rates within an interval a,b of a function fx is given by A=fb-fab-a
Q: Pressure Scientist Robert Boyle examined the relation-ship between the volume in which a gas is…
A:
Q: Find the average value of a function over an interval Question Determine the average value of g(x) =…
A:
Q: Sound Intensity The table lists intensities of sounds as multiples of a basic reference sound. A…
A: In this case, we need to construct the scatterplot for linear, quadratic, logarithmic, exponential,…
Q: Find the population density for each country. i) Canada: 30,007,094 people in 9,984,670 km2 ii)…
A:
Q: Quantitative Level of Variable Qualitative measurement Discrete Continuous 1) Weight of a rat in…
A: Please tick the variable of each statement either qualitative or quantitative. Then, write the level…
Q: Monthly Water Consumption (per cubic meter) Consumption Intervals No. of families 60-74 11 75-89 9.…
A:
Q: Real wage is a wage deflated by the current consumer price index. It gives information on how much…
A: The decile calculated by which each group is divided as the one tenth of the population group. It is…
Q: uestion 5 30 20 10 1 2 3 4 6. Wages (hundreds of dollars) The distribution of weekly income for a…
A: Histogram is an appropriate diagram to represent the frequency distribution of a continuous…
Q: Aptitude Score 0 1 2 3 4 5 Frequency 2 3 2 3 1 3 The average (mean) aptitude score: The median…
A: The mean of attitude score is 2.5 and it is obtained below: Attitude score (x)012345Frequency…
Q: The amount of damage done by a named storm is impacted in part by the number of days the storm stays…
A:
Q: Find the average value of the function on the interval. (x) = x² + 8; (-6, 6] Find all x-values in…
A: given function is f(x)=x2+8; [-6, 6] we have to find…
Q: distribution and ogive, the percentage cumulative of samples have S.G. of 2.55 or :more is
A: here given , result from the specific gravity test performed in soil laboratory here sample size n=…
Q: Class Boundaries Frequency midpoint TX (x) 7.5-12.5 12.5-17.5 17.5-22.5 15 22.5-27.5 27.5-32.5 2 mln
A: Given : Class Boundaries Frequency 7.5-12.5 3 12.5-17.5 5 17.5-22.5 15 22.5-27.5 5…
Q: Moving to another question will save this response. Question 6 Determine whether the variable is…
A: Discrete variable: Its value is obtained by counting. Continuous variable: Its value is obtained by…
Q: A medical staff takes the temperature of the patients before check-up. What type of variable refers…
A: Given: Variable: Number of patients with a temperature of at least 39 degree Celsius.
Q: Stem (hundred thousands) Leaf (ten thousands) 667778999 02447778889999 2 0011234445667889 3 00011225…
A: The stem and leaf plot for house sale price in Tarcoma is given as: Stem (Hundred thousands)…
Q: Population wealth as categorized by socioeconomic status classes (low, medium, high SES) is best…
A: Defination Ordinal data: Nominal data measures qualitative data but it measure in ordered.
Q: Stress A medical researcher measures the increase inheart rate of patients under a stress test. What…
A:
Q: A female height of _______________ corresponds to the 47th percentile in the U.S. population.
A:
Q: Type of Level of Variable variable measurement O Nominal O Ordinal O Interval O Ratio O Quantitative…
A: Types of variable: Quantitative variable is a measurable quantity, where the values are numerical,…
Q: Median Class Interval 0-9 10 - 19 20-29 30-39 40 - 49 fi 6 4 8 5 7 n = < CF
A: Given data is Class Interval fi <CF 0-9 6 10-19 4 20-29 8 30-39 5 40-49 7…
Q: Numerical and graphical information about a variable is called Theoretical statistics…
A: Introduction: It is required to identify the type of statistics that gives numerical and graphical…
Q: Continuous vs. Discrete variables Identify each quantitative variable as continuous or discrete.…
A:
Q: Health Survey In a survey of 1020 adults in the United States, 44% said that they wash their hands…
A: Note:Hey there! Thank you for the question. As your question has more than 3 parts, according to our…
Q: 27. The cost of living index number on a certain date was 200. From the base period the percentage…
A:
Q: Salary of employees of a company is an example of Select one: a. Interval Data O b. Ratio data O c.…
A: We know that Interval data represents data measured along a interval like likert scale While…
Q: Liquid leaked from a damaged tank at a rate of r(t) liters per hour. The rate decreased as time…
A: Solve for upper and lower estimate…
Q: Coal gas is produced at a gasworks. Pollutants in the gas are removed by scrubbers, which become…
A:
Q: Tabular presentation of Qualitative Data include Frequency distribution. Relative frequency…
A: As per our guidelines we can solve first three sub part of question and rest can be reposted…
Q: Refer to the graph given and answer The surface temperature of Jupiter is twice the temperature of…
A:
Q: 2. Discrete or continuous? а. the age of players on a hockey team b. the number of goals scored by…
A: Discrete Discrete data set is the data in which value is countable and finite. Example {1,2,3,4,6}…
Q: Range Demand Frequency Probability Cumulative Lower Higher Demand 10 5% 10 20 10% 20 50 25% 30 40…
A: we have assumed random numbers
Q: Range=Max value-Min Value h=R/m m=no of classes The following scores represent the final…
A: The histogram is a graphical representation of continuous frequency distribution. Here class limits…
Q: Statistical Thinking Health Survey: In a COVID-19 survey of 1200 adults in the United States, 60%…
A: Since we only do up to three subparts of a problem, we'll be doing the first three subparts only.…
Q: PERCENTILE RANK OF THE SCORE “3"? (score- LRLY interval size within interval) |(100) cf below…
A: The following is the formula of percentile score rank in frequency distribution
Q: A researcher is measuring class as an income variable [not ideal, but...]. The variable is the…
A: Ordinal data or "ordered data" that establishes a relative rank to categorical variables. Ordinal…
Q: 3] Provide an example of a qualitative variable. You may not use an example provided in th notes.
A:
Q: What explanations can you offer for the trends shown by the graph?
A: What explanations can you offer for the trends shown by the graph?
Q: Fahrenheit is the measurement of temperature commonly used in the US. On the Fahrenheit scale, water…
A: Given : Fahrenheit is the measurement of temperature commonly used in the US. On the Fahrenheit…
Q: Find the average value of the function over the indicated interval. (B) Graph the function and…
A: To find the average value of the function, fA=1b-a∫abf(x)dxWe have, f(x)=500-90x, a=0, b=2
Q: Cumulative Relative Percent relative Class Interval Frequency (f) frequency (cf) frequency frequency…
A: Class Interval Frequency, fi Mid value, xi fixi 150 to 156 8 153 1224 156 to 162 8 159 1272…
Q: Given the information, fill in the blanks
A:
Q: Salary of employees of a company is an example of Select one: a. Interval Data O b. Ratio data O c.…
A: Correct Option is B , Ratio Ratio data is a quantitative scale with no negative numerical value in…
Step by step
Solved in 2 steps
- Grade Point Average In many universities students are given grade points for each credit unit according to the following scale: A4 points B3 points C2 points D1 points F0 points For example, a grade of A in a 3-unit earns 43=12 grade points and grade points and a grade of B in a 5-unit course earns 35=15 grade points. A student’s grade point average (GPA) for these two courses is the total number of grade points earned divided by the number of units; in this case the GPA is (12+15)/8=3.375 . (a) Find a formula for a GPA of a student who earns a grade A in a units of course work, B in b units; C in c units, D in d units, and F in f units. (b) Find a GPA of a student who has earned a grade of A in two-units courses. B in one 4-unit course, and C in three 3-unit courses.Grade Point Average In many universities students are given grade points for each credit unit according to the following scale: A 4 points B 3 points C 2 points D 1 point F 0 point For example, a grade of A in a 3-unit course earns 43=12 grade points and a grade of B in a 5-unit course earns 35=15 grade points. A students grade point average GPA for these two courses is the total number of grade points earned divided by the number of units; in this case the GPA is (12+15)8=3.375. a Find a formula for the GPA of a student who earns a grade of A in a units of course work, B in b units, C in c units, D in d units and F in f units. b Find the GPA of a student who has earned a grade of A in two 3-unit courses, B in one 4-unit courses and C in three 3-unit courses.Mass-Luminosity Relation Roughly 90 of all stars are main-sequence stars. Exceptions include supergiants, giants, and dwarfs. For main-sequence stars including the sun, there is an important relationship called the mass-luminosity relation between the relative luminosity L and the mass M in terms of solar masses. Relative masses and luminosities of several main-sequence stars are reported in the accompanying table. Star Solar mass M Luminosity L Spica 7.3 1050 Vega 3.1 55 Altair 1 1.1 The Sun 1 1 61 Cygni A 0.17 0.002 a Find a power model for the data in this table. Round the power and the coefficient to one decimal place. The function you find is known to astronomers as the mass-luminosity relation. b Kruger 60 is a main sequence star that is about 0.11 solar mass. Use functional notation to express the relative luminosity of Kruger 60, and then calculate that value. c Wolf 359 has a relative luminosity of about 0.0001. How massive is Wolf 359? d If one star is 3 times as massive as another, how do their luminosities compare?
- Further Verification of Newtons Second LawThis exercise represents a hypothetical implementation of the experiment suggested in the solution of part 6 of Example 3.7. A mass of 15 kilograms was subjected to varying accelerations, and the resulting force was measured. In the following table, acceleration is in meters per second per second, and force is in newton. Acceleration Force 8 120 11 165 14 210 17 255 20 300 a. Construct a table of differences and explain how it shows that these data are linear. b. Find a linear model for the data. c. Explain in practical terms what the slope of this linear model is. d. Express, using functional notation, the force resulting from an acceleration of 15 meters per second per second, and then calculate that value. e. Explain how this experiment provides further evidence for Newtons second law of motion.Nutrition A biologist is performing an experiment on the effects of various combinations of vitamins. She wishes to feed each of her laboratory rabbits a diet that contains exactly 9mg of niacin, 14mg of thiamin, and 32mg of riboflavin. She has available three different types of commercial rabbit pellets; their vitamin content per ounce is given in the table. How many ounces of each type of food should each rabbit be given daily to satisfy the experiment requirements? Type A Type B Type C Niacin mg/oz 2 3 1 Thiamin mg/oz 3 1 3 Riboflavin mg/oz 8 5 7Nutrition A researcher performs an experiment to test a hypothesis is that involves the nutrients niacin and retinol. She feeds one group of laboratory rats daily of diet of precisely 32units of niacin and 22,000units of retinol. She uses two types of commercial foods. Food A contains 0.12unit of niacin and 100units of retinol per gram. Food B contains 0.20unit of niacin and 50units units of retinol per gram. How many grams of each does she feed this group of rats each day?