uestion 9 Given the histogram of percentage of cotton in material used to manufacture men's shirt. Choose the statement that best describes the cotton percentage data. 20 10 31.5 32.5 33.5 34.5 35.5 36.5 37.5 38.5 cotton percentage kɔuənbə
uestion 9 Given the histogram of percentage of cotton in material used to manufacture men's shirt. Choose the statement that best describes the cotton percentage data. 20 10 31.5 32.5 33.5 34.5 35.5 36.5 37.5 38.5 cotton percentage kɔuənbə

Glencoe Algebra 1, Student Edition, 9780079039897, 0079039898, 2018
18th Edition
ISBN:9780079039897
Author:Carter
Publisher:Carter
Chapter10: Statistics
Section: Chapter Questions
Problem 8SGR

Related questions
Question
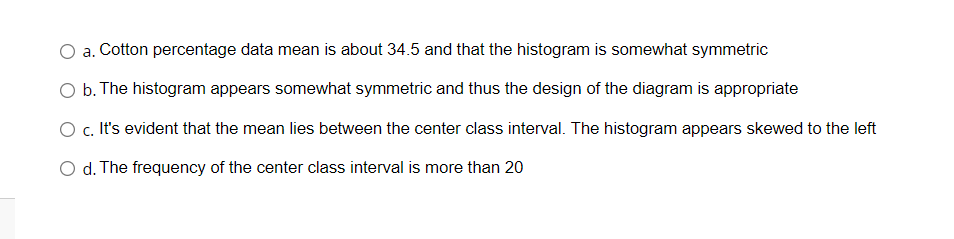
Transcribed Image Text:O a. Cotton percentage data mean is about 34.5 and that the histogram is somewhat symmetric
O b. The histogram appears somewhat symmetric and thus the design of the diagram is appropriate
O c. It's evident that the mean lies between the center class interval. The histogram appears skewed to the left
d. The frequency of the center class interval is more than 20
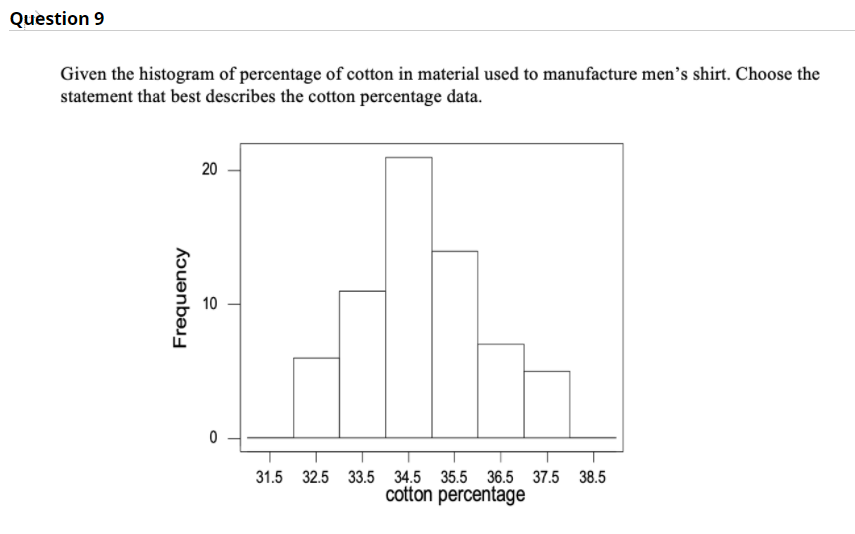
Transcribed Image Text:Question 9
Given the histogram of percentage of cotton in material used to manufacture men's shirt. Choose the
statement that best describes the cotton percentage data.
20
10
31.5
32.5 33.5
34.5 35.5 36.5 37.5 38.5
cotton percentage
Frequency
Expert Solution
This question has been solved!
Explore an expertly crafted, step-by-step solution for a thorough understanding of key concepts.

Step by step
Solved in 2 steps with 2 images

Recommended textbooks for you
Glencoe Algebra 1, Student Edition, 9780079039897…
Algebra
ISBN:
9780079039897
Author:
Carter
Publisher:
McGraw Hill
Glencoe Algebra 1, Student Edition, 9780079039897…
Algebra
ISBN:
9780079039897
Author:
Carter
Publisher:
McGraw Hill