An admissions director wants to estimate the mean age of all students enrolled at a college. The estimate must be within 1.7 years of the population mean. Assume the population of ages is normally distributed. (a) Determine the minimum sample size required to construct a 90% confidence interval for the population mean. Assume the population standard deviation is 1.8 years. b) The sample mean is 20 years of age. Using the minimum sample size with a 90% level of confidence, does it seem likely that the population mean could be within 10% of the sample mean? within 11% of the sample mean? Explain. Click here to view page 1 of the Standard Normal Table. Click here to view page 2 of the Standard Normal Table, a) The minimum sample size required Round up to the nearest whole number.) construct a 90% confidence interval is 4 students. b) The 90% confidence interval is (.). It seem likely that the population mean could be within 10% of the sample mean because 10% off from the sample mean would fall V the confidence interval. It V seem ikely that the population mean could be within 11% of the sample mean because 11% off from the sample mean would fall Round to two decimal places as needed.) V the confidence interval. inside outside
An admissions director wants to estimate the mean age of all students enrolled at a college. The estimate must be within 1.7 years of the population mean. Assume the population of ages is normally distributed. (a) Determine the minimum sample size required to construct a 90% confidence interval for the population mean. Assume the population standard deviation is 1.8 years. b) The sample mean is 20 years of age. Using the minimum sample size with a 90% level of confidence, does it seem likely that the population mean could be within 10% of the sample mean? within 11% of the sample mean? Explain. Click here to view page 1 of the Standard Normal Table. Click here to view page 2 of the Standard Normal Table, a) The minimum sample size required Round up to the nearest whole number.) construct a 90% confidence interval is 4 students. b) The 90% confidence interval is (.). It seem likely that the population mean could be within 10% of the sample mean because 10% off from the sample mean would fall V the confidence interval. It V seem ikely that the population mean could be within 11% of the sample mean because 11% off from the sample mean would fall Round to two decimal places as needed.) V the confidence interval. inside outside

MATLAB: An Introduction with Applications
6th Edition
ISBN:9781119256830
Author:Amos Gilat
Publisher:Amos Gilat
Chapter1: Starting With Matlab
Section: Chapter Questions
Problem 1P

Related questions
Question
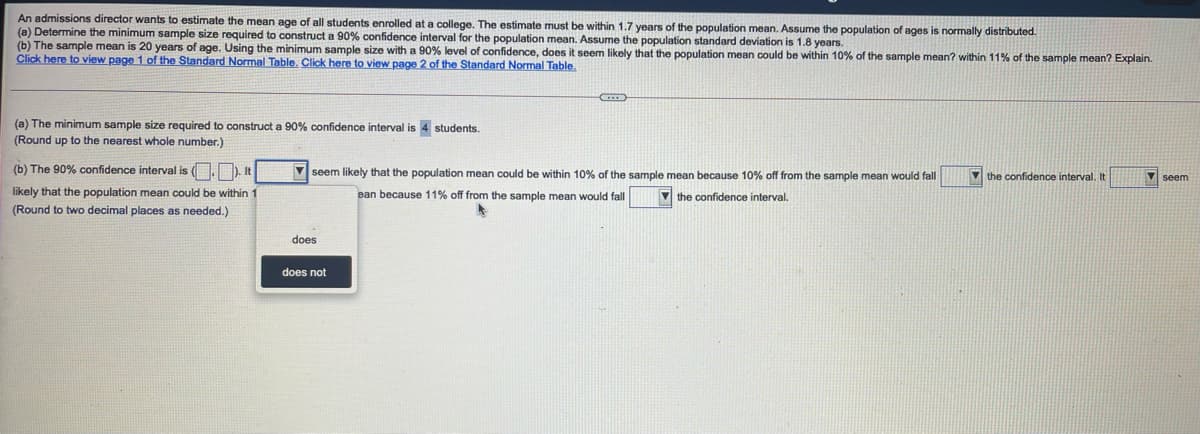
Transcribed Image Text:An admissions director wants to estimate the mean age of all students enrolled at a college. The estimate must be within 1.7 years of the population mean. Assume the population of ages is normally distributed.
(a) Determine the minimum sample size required to construct a 90% confidence interval for the population mean. Assume the population standard deviation is 1.8 years.
(b) The sample mean is 20 years of age. Using the minimum sample size with a 90% level of confidence, does it seem likely that the population mean could be within 10% of the sample mean? within 11% of the sample mean? Explain.
Click here to view page 1 of the Standard Normal Table. Click here to view page 2 of the Standard Normal Table.
(a) The minimum sample size required to construct a 90% confidence interval is 4 students.
(Round up to the nearest whole number.)
(b) The 90% confidence interval is (O.). It
V seem likely that the population mean could be within 10% of the sample mean because 10% off from the sample mean would fall
V the confidence interval. It
likely that the population mean could be within 1
ean because 11% off from the sample mean would fall
V the confidence interval.
(Round to two decimal places as needed.)
does
does not
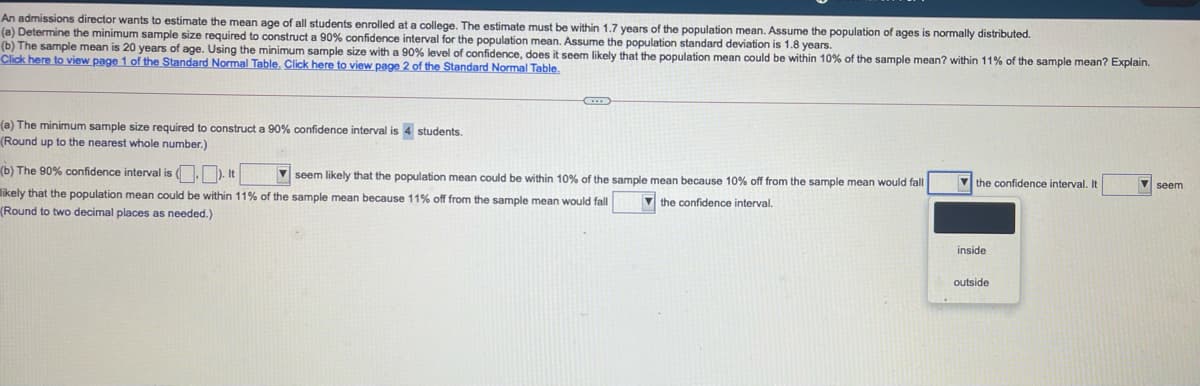
Transcribed Image Text:An admissions director wants to estimate the mean age of all students enrolled at a college. The estimate must be within 1.7 years of the population mean. Assume the population of ages is normally distributed.
(a) Determine the minimum sample size required to construct a 90% confidence interval for the population mean. Assume the population standard deviation is 1.8 years.
(b) The sample mean is 20 years of age. Using the minimum sample size with a 90% level of confidence, does it seem likely that the population mean could be within 10% of the sample mean? within 11% of the sample mean? Explain.
Click here to view page 1 of the Standard Normal Table. Click here to view page 2 of the Standard Normal Table.
(a) The minimum sample size required to construct a 90% confidence interval is 4 students.
(Round up to the nearest whole number.)
(b) The 90% confidence interval is (O.D. It
V seem likely that the population mean could be within 10% of the sample mean because 10% off from the sample mean would fall
V the confidence interval. It
seem
likely that the population mean could be within 11% of the sample mean because 11% off from the sample mean would fall
(Round to two decimal places as needed.)
V the confidence interval.
inside
outside
Expert Solution
This question has been solved!
Explore an expertly crafted, step-by-step solution for a thorough understanding of key concepts.

This is a popular solution!

Trending now
This is a popular solution!

Step by step
Solved in 3 steps

Recommended textbooks for you
MATLAB: An Introduction with Applications
Statistics
ISBN:
9781119256830
Author:
Amos Gilat
Publisher:
John Wiley & Sons Inc

Probability and Statistics for Engineering and th…
Statistics
ISBN:
9781305251809
Author:
Jay L. Devore
Publisher:
Cengage Learning

Statistics for The Behavioral Sciences (MindTap C…
Statistics
ISBN:
9781305504912
Author:
Frederick J Gravetter, Larry B. Wallnau
Publisher:
Cengage Learning
MATLAB: An Introduction with Applications
Statistics
ISBN:
9781119256830
Author:
Amos Gilat
Publisher:
John Wiley & Sons Inc
Probability and Statistics for Engineering and th…
Statistics
ISBN:
9781305251809
Author:
Jay L. Devore
Publisher:
Cengage Learning
Statistics for The Behavioral Sciences (MindTap C…
Statistics
ISBN:
9781305504912
Author:
Frederick J Gravetter, Larry B. Wallnau
Publisher:
Cengage Learning

Elementary Statistics: Picturing the World (7th E…
Statistics
ISBN:
9780134683416
Author:
Ron Larson, Betsy Farber
Publisher:
PEARSON

The Basic Practice of Statistics
Statistics
ISBN:
9781319042578
Author:
David S. Moore, William I. Notz, Michael A. Fligner
Publisher:
W. H. Freeman

Introduction to the Practice of Statistics
Statistics
ISBN:
9781319013387
Author:
David S. Moore, George P. McCabe, Bruce A. Craig
Publisher:
W. H. Freeman