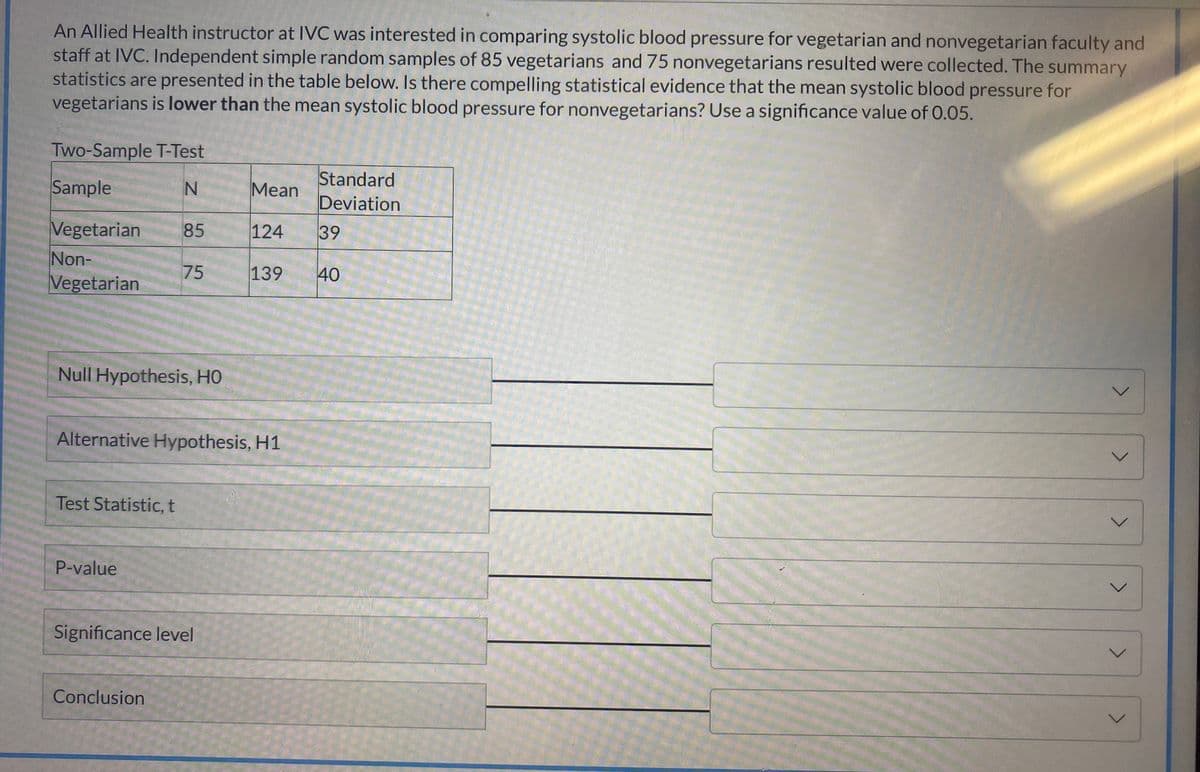
An Allied Health instructor at IVC was interested in comparing systolic blood pressure for vegetarian and nonvegetarian faculty and staff at IVC. Independent simple random samples of 85 vegetarians and 75 nonvegetarians resulted were collected. The summary statistics are presented in the table below. Is there compelling statistical evidence that the mean systolic blood pressure for vegetarians is lower than the mean systolic blood pressure for nonvegetarians? Use a significance value of 0.05. Two-Sample T-Test Standard Deviation Sample Mean Vegetarian Non- Vegetarian 85 124 39 75 139 40
An Allied Health instructor at IVC was interested in comparing systolic blood pressure for vegetarian and nonvegetarian faculty and staff at IVC. Independent simple random samples of 85 vegetarians and 75 nonvegetarians resulted were collected. The summary statistics are presented in the table below. Is there compelling statistical evidence that the mean systolic blood pressure for vegetarians is lower than the mean systolic blood pressure for nonvegetarians? Use a significance value of 0.05. Two-Sample T-Test Standard Deviation Sample Mean Vegetarian Non- Vegetarian 85 124 39 75 139 40

Glencoe Algebra 1, Student Edition, 9780079039897, 0079039898, 2018
18th Edition
ISBN:9780079039897
Author:Carter
Publisher:Carter
Chapter10: Statistics
Section10.3: Measures Of Spread
Problem 1GP

Related questions
Question
100%
Transcribed Image Text:An Allied Health instructor at IVC was interested in comparing systolic blood pressure for vegetarian and nonvegetarian faculty and
staff at IVC. Independent simple random samples of 85 vegetarians and 75 nonvegetarians resulted were collected. The summary
statistics are presented in the table below. Is there compelling statistical evidence that the mean systolic blood pressure for
vegetarians is lower than the mean systolic blood pressure for nonvegetarians? Use a significance value of 0.05.
Two-Sample T-Test
Standard
Deviation
Sample
Mean
Vegetarian
Non-
Vegetarian
85
124
39
75
139
40
Null Hypothesis, HO
レ
Alternative Hypothesis, H1
Test Statistic, t
P-value
く
Significance level
く
Conclusion
Expert Solution
This question has been solved!
Explore an expertly crafted, step-by-step solution for a thorough understanding of key concepts.

This is a popular solution!

Trending now
This is a popular solution!

Step by step
Solved in 3 steps with 3 images

Recommended textbooks for you
Glencoe Algebra 1, Student Edition, 9780079039897…
Algebra
ISBN:
9780079039897
Author:
Carter
Publisher:
McGraw Hill

College Algebra (MindTap Course List)
Algebra
ISBN:
9781305652231
Author:
R. David Gustafson, Jeff Hughes
Publisher:
Cengage Learning
Glencoe Algebra 1, Student Edition, 9780079039897…
Algebra
ISBN:
9780079039897
Author:
Carter
Publisher:
McGraw Hill
College Algebra (MindTap Course List)
Algebra
ISBN:
9781305652231
Author:
R. David Gustafson, Jeff Hughes
Publisher:
Cengage Learning