An article in the IEEE Transactions on Instrumentation and Measurement ("Direct, Fast, and Accurate Measurement of Vr and K of MOS Transistor Using VT-Sift Circui 1991, Vol. 40, pp. 951-955) described the use of a simple linear regression model to express drain current y (in milliamperes) as a function of ground-to-source vol" x (in volts). The data are as follows: 0.734 0.886 1.04| 1.19 1.35 1.50 1.66 1.81 1.97 2.12 1.1 1.2 1.3 1.4 1.5 1.6 1.7 1.8 1.9 2.0 Round your answers to 3 decimal places. (a) Fit a simple linear regression model to these data. Bo = i i (b) Test for significance of regression using a = 0.05. (c) Find a 95.00% confidence interval estimate on the slope. 93°F Mostly sunny
An article in the IEEE Transactions on Instrumentation and Measurement ("Direct, Fast, and Accurate Measurement of Vr and K of MOS Transistor Using VT-Sift Circui 1991, Vol. 40, pp. 951-955) described the use of a simple linear regression model to express drain current y (in milliamperes) as a function of ground-to-source vol" x (in volts). The data are as follows: 0.734 0.886 1.04| 1.19 1.35 1.50 1.66 1.81 1.97 2.12 1.1 1.2 1.3 1.4 1.5 1.6 1.7 1.8 1.9 2.0 Round your answers to 3 decimal places. (a) Fit a simple linear regression model to these data. Bo = i i (b) Test for significance of regression using a = 0.05. (c) Find a 95.00% confidence interval estimate on the slope. 93°F Mostly sunny

Functions and Change: A Modeling Approach to College Algebra (MindTap Course List)
6th Edition
ISBN:9781337111348
Author:Bruce Crauder, Benny Evans, Alan Noell
Publisher:Bruce Crauder, Benny Evans, Alan Noell
Chapter5: A Survey Of Other Common Functions
Section5.6: Higher-degree Polynomials And Rational Functions
Problem 1TU: The following fictitious table shows kryptonite price, in dollar per gram, t years after 2006. t=...

Related questions
Question
4
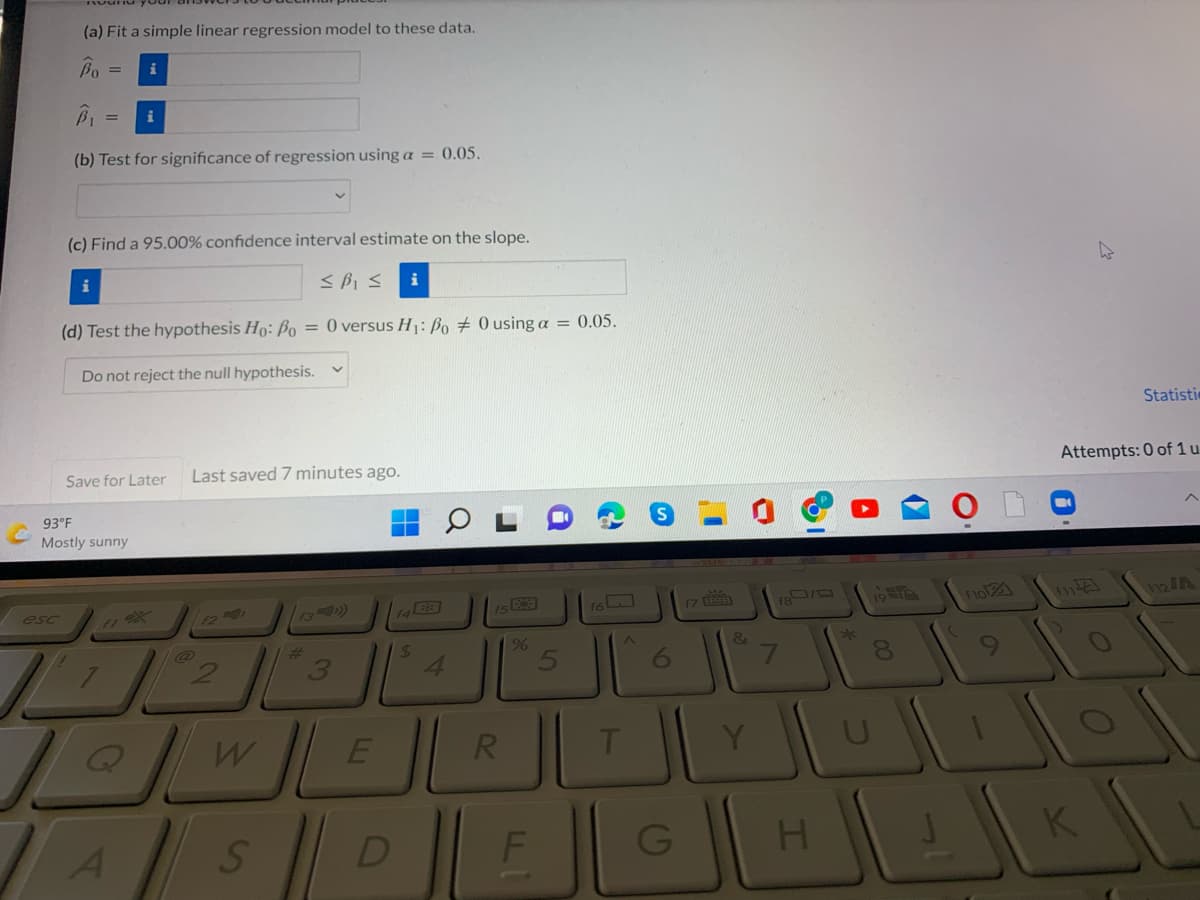
Transcribed Image Text:(a) Fit a simple linear regression model to these data.
Bo
i
%3D
(b) Test for significance of regression using a = 0.05.
(c) Find a 95.00% confidence interval estimate on the slope.
i
< BI s
i
(d) Test the hypothesis Ho: B, = 0 versus H|: Bo ± 0 using a = 0.05.
Do not reject the null hypothesis. v
Statisti
Save for Later
Last saved 7 minutes ago.
Attempts: 0 of 1 u
93°F
Mostly sunny
12IA
11%
13)
14
「7 国
esc
%6
&
24
4.
%23
3
6.
T
Y
D
F
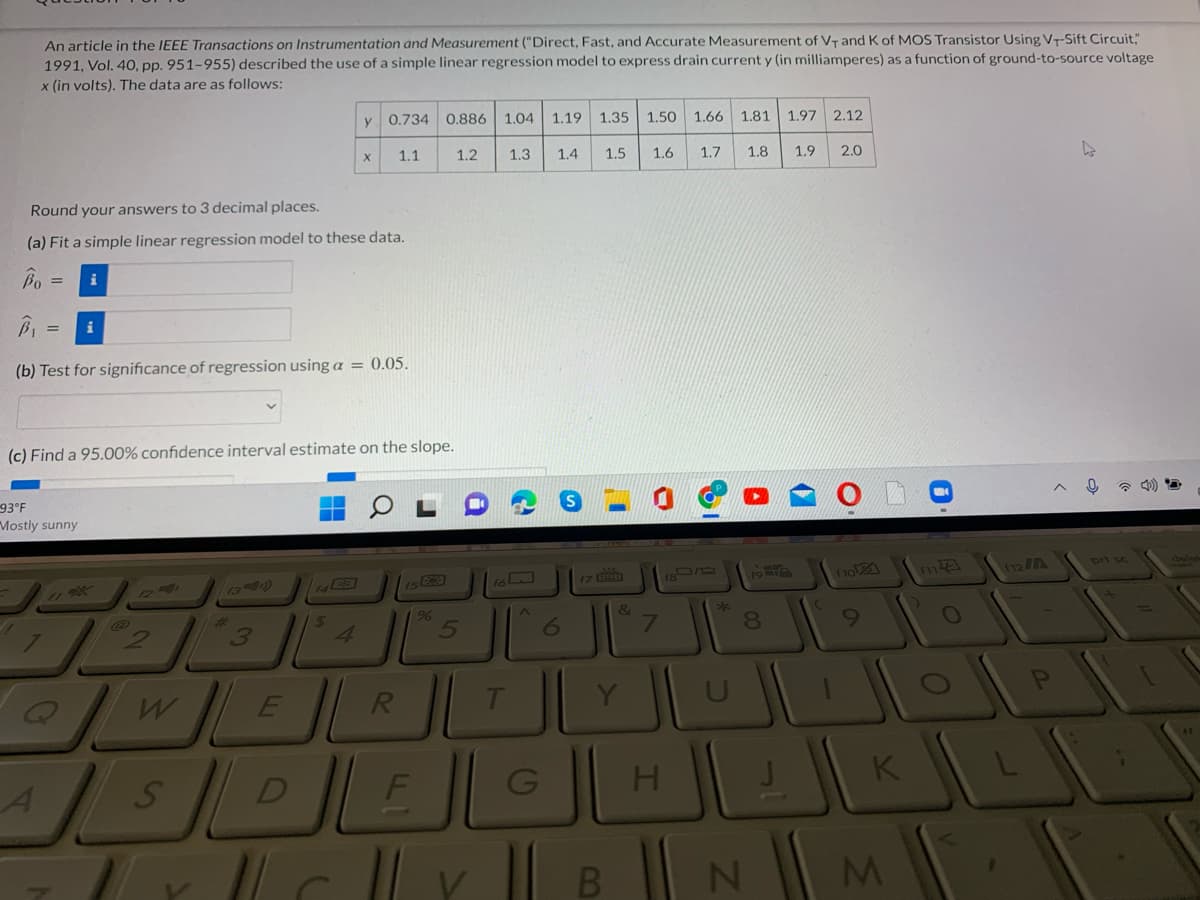
Transcribed Image Text:An article in the IEEE Transactions on Instrumentation and Measurement ("Direct, Fast, and Accurate Measurement of VT and K of MOS Transistor Using VT-Sift Circuit,"
1991, Vol. 40, pp. 951-955) described the use of a simple linear regression model to express drain current y (in milliamperes) as a function of ground-to-source voltage
x (in volts). The data are as follows:
y
0.734 0,886 1.04 1.19 1.35
1.50 1.66 1.81 1.97 2.12
1.1
1.2
1.3
1.4
1.5
1.6
1.7
1.8
1.9
2.0
Round your answers to 3 decimal places.
(a) Fit a simple linear regression model to these data.
Bo =
i
i
(b) Test for significance of regression using a = 0.05.
(c) Find a 95.00% confidence interval estimate on the slope.
93°F
Mostly sunny
124
13)
19 e
f12/A
prt sc
%3
9%
3
7.
8.
R.
A
D
G
H
K
Expert Solution
This question has been solved!
Explore an expertly crafted, step-by-step solution for a thorough understanding of key concepts.

This is a popular solution!

Trending now
This is a popular solution!

Step by step
Solved in 2 steps with 1 images

Recommended textbooks for you
Functions and Change: A Modeling Approach to Coll…
Algebra
ISBN:
9781337111348
Author:
Bruce Crauder, Benny Evans, Alan Noell
Publisher:
Cengage Learning
Functions and Change: A Modeling Approach to Coll…
Algebra
ISBN:
9781337111348
Author:
Bruce Crauder, Benny Evans, Alan Noell
Publisher:
Cengage Learning