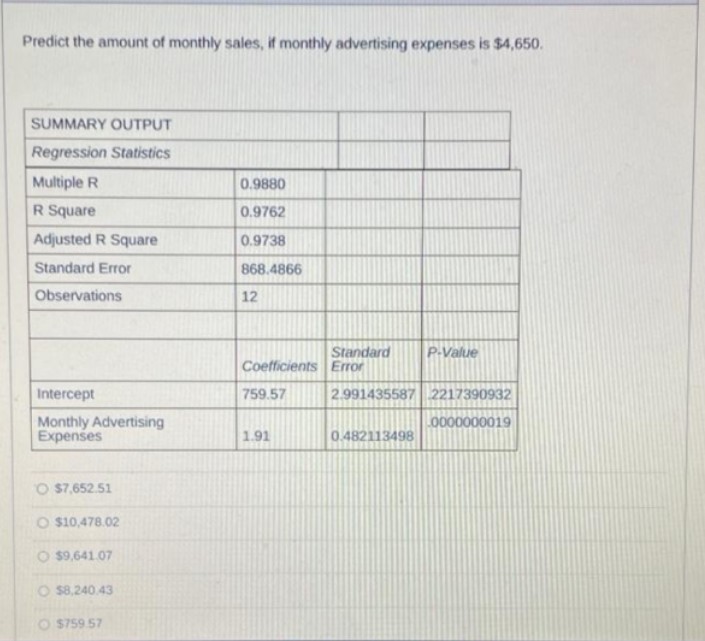
Predict the amount of monthly sales, if monthly advertising expenses is $4,650


Q: The claim that a coin is fair is to be tested. Let p denote the probability that "head" is observed…
A:
Q: d. ta and n = 8 for the 95% confidence interval for the mean. 2 е. ta and n= 21 for the 85%…
A:
Q: 1. An experimental study was conducted by a researcher to determine if a new time slot has an effect…
A:
Q: Consider the following (x, y) data. X -4 -3 -3 -2 -2 -1 -1 1. 3 3 4 y 0 -2.65 2.65 -3.46 3.46 -3.87…
A: Given,
Q: a. What is the p value of the test of B2 = 0? b. Вi + 2B2 %3D 5? c. B1 – B2 + 2ß3 = 5?
A:
Q: Use the sample data and confidence level given below to complete parts (a) through (d). A drug is…
A: Given,n=4649x=187
Q: A change of a dependent variable is all due to a manipulation of intended independent variables .…
A: The probability of a independent variable does not depend on other independent variables. A…
Q: A recent Gallup Poll interviewed a random sample of 1,523 adults. Of these, 868 boughta lottery…
A:
Q: An insurer offers a coverage with a policy limit of 1500. The following four claims are observed on…
A:
Q: The following table shows the weekly sales, test scores & achievement ratings of 5 salespersons…
A: Use EXCEL to determine the regression equation. EXCEL procedure: Go to EXCEL Go to Data>Data…
Q: Here are summary statistics for randomly selected weights of newborn girls: n=170, x= 27.6 hg, s=…
A: From the given information we find the 95% confidence interval.
Q: According to the American Pet Products Manufacturers Association, cat owners spend an average of…
A:
Q: A sample of human brain volumes (cm) is given below. Use the given data values to identify the…
A: Given data: 1073, 1041, 1087, 955, 1061, 1087, 1401, 1043
Q: three populations. The data obtained are shown below. Please note that the sample sizes are not…
A:
Q: Find the unknown value from the following probability distribution.
A: X 1 2 3 4 P(X) 2 a 4 a 4 a a
Q: Which of the following sampling techniques is considered as a method of probability sampling? A…
A: Non Probability Sampling: If a sample is not chosen based on probability known as the method of…
Q: The table below reports the annual stock price in September for Apple from 2005 to 2014. Develop a…
A: Index number are used to measure the increase in price over a period of time. It is broadly…
Q: ted to determine if there was an association between daily cantaloupe consumption and the occurrence…
A: Based in the given data Step a (option B ) This is a cross-ectional because the reserchers lokked at…
Q: Example 18.15 The trend equation for annual sales of a product is- Y = 102 + 36 X with 1st January…
A:
Q: Happy Pet, Inc., is a large pet store located in Long Beach Mall. Although the store specializes in…
A:
Q: Required: 1. Create a scatter plot for the consumption & price. 2. Calculate the correlation…
A:
Q: Sammy Electronics have determined that its 50 inch LED television has a mean service life of 6 years…
A: Sammy Electronics have determined that its 50 inch LED television has a mean service life of 6 years…
Q: Angela polled her first grade class about their family pets. The following data lists the number of…
A:
Q: You compare the height (cm) and weight (kg) of 5 adult women. You get the following results: height…
A: From the given data, Height (X) Weight (Y) XY X2 Y2 152.4 54 8229.6 23225.76 2916…
Q: p-stock index
A: Given that the table below to compute both the DIJ-type index and market weighted index for a…
Q: Vocabulary Terms experimental units experiment retrospective study treatment observational…
A: The objective is to define each of the given terms.
Q: ou are conducting a multinomial hypothesis test for the claim that all 5 categories are equally…
A:
Q: Here is a data set that has a nearly normal distribution. data data data data 61.77 55.7 50.27…
A: Given data is…
Q: Identify the rejection region. Follow the given steps in identifying the appropriate ejection…
A: From the given information we find the rejection region. (-∞, -2.7079] ∪ [2.7079, ∞)
Q: A Department of Motor Vehicles office claims that the mean wait time is less than 14 minutes. A…
A: It is given that Sample size n = 10 Sample mean M = 13 Sample SD s = 3.5 Level of significance =…
Q: If about 75% of the students of a certain university are expected to use a laptop for online…
A: Given,sample proportion (p^)=0.75margin of error(E)=0.05α=1-0.99=0.01α2=0.005Z0.005=2.5758…
Q: Example 18.14 The linear trend of sales of a company is Rs 6,50,000 in 1995 and it rises by Rs…
A:
Q: 37.5 5.9894 37.9 7.5422 44.5 8.7951 37.9 6.0831 38.9 8.3607 36.9 8.1400 45.8 9.1416 (a) Calculate…
A:
Q: 4. Y = 0.43X + 1.1; X = 0.97 5. Y = X +:X = 6. Assume that the height of fathers (X) and the height…
A:
Q: In a survey, 20 people were asked how much they spent on their child's last birthday gift. The…
A: Solution-: Given: x¯=35,n=20,s=16,α=0.10 We want find a 90% C.I.
Q: Suppose that 40% of people own dogs. If you pick two people at random, what is the probability that…
A: Given that n = 2 ,p =0.4 P ( x =2 ) =?
Q: ACTIVITY Predict the value of Y given the regression line and the value of X in each item. 1. Y =…
A: Since you have posted a question with multiple sub-parts, we will solve first 3 subparts for you. To…
Q: 6. The proportion of studcnts at a school that slcep at least 7 hours a night is 60%. Which of the…
A:
Q: A standard deck of cards contains 52 cards. One card is selected from the deck. (a) Compute the…
A:
Q: An article in the Journal of Sound and Vibration (Vol. 151, 1991, pp. 383-394) described a study…
A:
Q: A survey of 400 students at Red Rock College found that 180 planned to take summer classes. Find a…
A:
Q: Houston North Hospital is trying to improve its image by providing a positive experience for its…
A:
Q: Example 19.9 Suppose we have the following series of 29 college students. After performing a set of…
A:
Q: researcher estimates that the average height of the buildings of 30 or more stories in a large city…
A:
Q: The United States Environmental Protection Agency6 reports that in 2006, each American generated 4.6…
A:
Q: A previous study claims that the average time a teenager spends browsing his social media accounts…
A: Sample size(n)=100 Population mean(μ)=6 Sample mean(x)=5.5 Standard deviation(σ)=0.5
Q: Let Y1, . . . , YN be a random sample from the Normal distribution Yi ∼ N(ln β, s2) where s^2 is…
A:
Q: The Wilson family had 9 children. ASsuming that the probability of a child being a girl is 0.5, find…
A:
Q: Ice cream consumption is shown in the given data. The price of the ice cream is in dollar and the…
A: ( g ) Compute and interpret R^2 ( h ) Predict consumption if price is 1.38
Q: r an indifference curve through the consumption bundle (100,100) (solve for X2 on the ft hand side…
A:

Step by step
Solved in 2 steps

- Use tables to express and represent the descriptive statistics for thevariables below. Years GDP growth (annual %) Gross capital formation (annual % growth) Labor force participation rate, total (% of total population ages 15-64) (modeled ILO estimate) 2019 0.892 2.556 71.38 2018 1.89 3.862 70.44 2017 0.997 6.158 71.15 2016 1.375 -0.103 70.31 2015 0.921 -6.13 68.74 2014 0.69 3.84 68.39 2013 0.518 5.473 68.53 2012 -0.614 -5.75 67.42 2011 1.73 8.972 67.63 2010 -1.457 -2.039 67.84 2009 -4.345 -18.427 68.15 2008 -0.8117 -8.009 68.46Socially conscious investors screen out stocks of alcohol and tobacco makers, firms with poorenvironmental records, and companies with poor labor practices. Some examples of “good,” sociallyconscious companies are Johnson and Johnson, Dell Computers, Bank of America, and Home Depot. Thequestion is, are such stocks overpriced? One measure of value is the P/E, or price-to-earnings, ratio. High P/Eratios may indicate a stock is overpriced. For the S&P stock index of all major stocks, the mean P/E ratio is? = 19.4 . A random sample of 36 “socially conscious” stocks gave a P/E ratio sample mean of ?̅= 17.9,with sample standard deviation ? = 5.2 (Reference: Morningstar, a financial analysis company in Chicago). 2.2.1. Does this indicate that the mean P/E ratio of all socially conscious stocks is different (either way) fromthe mean P/E ratio of the S&P stock index? Use ? = 0.05 [6 marks]2.2.2. What is the P-value?A clinic developed a diet to impact body mass (fat and muscle). A nutritionist in the clinic hypothesizes that heavier individuals on the diet will predict less body fat. Below are the data for a sample of clients from the clinic. Weight is measured in kilograms (kg) and percentage body fat is estimated through skinfold measurement. What can the nutritionist conclude with α = 0.01? Weight Fat 90896760947483781016867 2928252430263026312430 a) What is the appropriate statistic? Compute the statistic selected in a) b Obtain/compute the appropriate values to make a decision about H0. critical value= test statistic= c) Compute the corresponding effect size(s) and indicate magnitude(s).If not appropriate, input and/or select "na" below.
- The table below contains the value of the house and the amount of rental income in a year that the house brings in ("Capital and rental," 2013). Table: Data of House Value versus Rental Value Rental Value Rental Value Rental Value Rental 81000 6656 77000 4576 75000 7280 67500 6864 95000 7904 94000 8736 90000 6240 85000 7072 121000 12064 115000 7904 110000 7072 104000 7904 135000 8320 130000 9776 126000 6240 125000 7904 145000 8320 140000 9568 140000 9152 135000 7488 165000 13312 165000 8528 155000 7488 148000 8320 178000 11856 174000 10400 170000 9568 170000 12688 200000 12272 200000 10608 194000 11232 190000 8320 214000 8528 208000 10400 200000 10400 200000 8320 240000 10192 240000 12064 240000 11648 225000 12480 289000 11648 270000 12896 262000 10192 244500 11232…Assuming normal populations, is there any evidence to suggest that the price duduction, on average, more than $17 at 5% level of significance? product A B C D E F G H I J Before ($) 191 204 222 209 196 179 195 204 210 235 After ($) 172 181 205 194 174 163 176 189 188 206The Kentucky Department of Agriculture is concerned about the number of acres of farmland being withdrawn from farming. The department would like to propose new legislation to prevent this but wants to show the legislature what would happen if it does not act. Drew Johnson, the department’s statistician, regresses the number of acres used for farming in the state on time. Johnson finds the following: Model Summary Model R R Square Adjusted R Square Std. Error of the Estimate 1 .943a .890 .795 3.2875 a. Predictors: (Constant), Number of Years ANOVAb Model Sum of Squares df Mean Square F Sig. 1 Regression 1378.458 1 1378.458 141.149 .000a Residual 478.567 49 9.766 Total 1857.025 50 a. Predictors: (Constant), Number of Years b. Dependent Variable: Acres (in Millions) Coefficientsa Model Unstandardized Coefficients Standardized Coefficients t Sig.…
- GreenLawns provides a lawn fertilizing and weed control service. The company is adding a special aeration treatment as a low-cost extra service option, which it hopes will help attract new customers. Management is planning to promote this new service in two media: radio and direct-mail advertising. A media budget of $4,000 is available for this promotional campaign. Based on past experience in promoting its other services, GreenLawns has obtained the following estimate of the relationship between sales and the amount spent on promotion in these two media: S = -2R2 − 12M2 − 9RM + 20R + 39M, Where S = total sales in thousands of dollars R = thousands of dollars spent on radio advertising M = thousands of dollars spent on direct-mail advertising GreenLawns would like to develop a promotional strategy that will lead to maximum sales subject to the restriction provided by the media budget. (a) What is the value of sales if $3,000 is spent on radio advertising and $1,000 is…Kaitlyn measures the upload speed in megabits per second of her home broadband internet connection during peak hours and off-peak hours. The results are provided in the accompanying table. Peak Off-Peak 5.83 5.14 6.05 6.80 7.14 6.98 3.54 5.77 5.45 7.27 5.90 6.62 5.81 6.19 4.82 6.08 6.37 6.59 4.65 5.58 5.30 7.41 6.48 6.26 5.96 6.37 5.79 6.31 6.84 6.55 5.06 4.95 5.61 7.03 6.45 6.77 Examine the results of Kaitlyn's test to determine the statements that compare the medians and interquartile ranges of the data sets to each other in terms of this situation. Select the two correct answers. The median upload speed during peak hours is 5.905 megabits per second, which is less than the median upload speed during off-peak hours, 7.005 megabits per second. The upload speeds during peak hours are slower on average compared to off-peak times. The median upload speed during peak hours is 6.37 megabits per second, which is greater than the median upload speed during…Determine if the following scenarios involve an observational study or an experiment. Make sure your answers are legible and spelled correctly. A team of ecologists determines the different species of frogs that live in the local swamplands. A medical researcher divides patients into a treatment group and a control group to determine the effect of a new drug on overall cholesterol levels in patients. A medical insurance company determines the average cost to cover a tooth extraction procedure over the past 3 years. As part of a medical study to determine the effectiveness of a new technique for abdominal surgery, patients undergo the surgery with the new technique or with a traditional technique. The recovery time from surgery is then compared for the two different techniques. The general manager of a baseball team determines the on-base percentage (OBP) for his players over the past two seasons. A dietitian examined the effectiveness of a weight-loss program by randomly…
- The prices and the numbers of various items produced by a small machine and stamping plant are reported below. Use 2010 as the base. 2010 2018 Item Price (in $) Quantity Price (in $) Quantity Washer 0.07 17,000 0.10 20,000 Cotter pin 0.04 125,000 0.03 130,000 Stove bolt 0.15 40,000 0.15 42,000 Hex nut 0.08 62,000 0.10 65,000 a. Determine the Laspeyres price index. (Round your answer to 2 decimal places.) b. Determine the Paasche price index. (Round your answer to 2 decimal places.)The general perception is that the manufacturer of the product can reduce the cost required to manufacture a single product by increasing the number of manufactured products. The following material lists the quantities of products produced by one manufacturer and the corresponding costs per product. Material: nro of products 10 20 50 100 150 200 manufacturing cost per product 9.4 9.2 9.0 8.5 8.1 7.4 a) Calculate the forecast for the product-specific manufacturing cost when a batch of 125 products has been ordered from the manufacturer.b) Estimate the variance parameter σ2 of the linear model in point a.c) Calculate the 99 percent prediction interval for the manufacturing cost per product when a batch of 110 products is ordered from the manufacturer.Use Microsoft Excel (or any other software package) to estimate the following model: y^=b0+b1x For the data provided below: Y X 50 36 49 28 34 38 32 33 50 14 30 38 41 17 42 36 42 14 43 17 What is the residual when x = 28. Please keep your answer to two decimal places.


