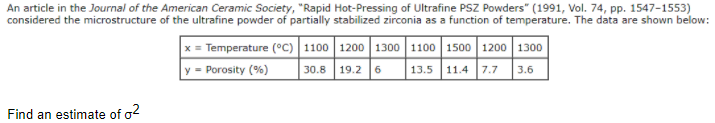
An article in the Journal of the American Ceramic Society, "Rapid Hot-Pressing of Ultrafine PSZ Powders" (1991, Vol. 74, pp. 1547-1553) considered the microstructure of the ultrafine powder of partially stabilized zirconia as a function of temperature. The data are shown below x = Temperature (°C) | 1100 1200 1300 1100 1500 1200 1300 y = Porosity (%) 30.8 19.2 6 13.5 11.4 7.7 3.6 Find an estimate of g?


Q: Calculate the test statistic and P-value. (Round your test statistic to two decimal places and your…
A:
Q: paueltssulle proglalml. THe and are approximate values read from a scatterplot in the paper. BMI…
A:
Q: This problem is to determine what the class width and the first lower class limit should be. What…
A: The goal is to construct a grouped frequency distribution table (GFDT) for this data set. The GFDT…
Q: Q2- The following table includes the grades of students who took Math during Fall. 40 55 50 55 28 60…
A: The data is 40,55,50,55,28,60,25,55,60,65,70,64,62,70,50,65,55,48,69,25,64,58,55,71
Q: Problem 2.1: The probability distribution for the discrete random variable X is described in the…
A:
Q: describes the probability of successes inn draws, with replacement, from a finite population of…
A: Please note that as per our guidelines we can answer the first three sub-parts. Please repost the…
Q: The High Mileage Tire Co. manufactures a particular tire model that has a mean lifetime of 80,000…
A: From the provided information, Mean (µ) = 80000 Standard deviation (σ) = 6000 X~N (80000, 6000)
Q: A manufacturer claims that the average strength of light duty cable ties is 130 pounds, but a…
A: Given that Sample size n =15 Sample mean =128.7 Sample standard deviation =8.8
Q: NASA estimates that the probability that a certain component in a communication satellite fails is…
A: Given probability that a certain component in a communication satellite fails is .016. the…
Q: hour. Is it reasonable to assume that the wage rate of the Amazon workers is equivalent to that of a…
A: Workers in a certain town have an average wage of $7 per hour, with a standard deviation of $0.50.…
Q: Part 1: OLS basics Consider the data in the table below. Y X 3 1 8. 3 2 1 7 1. In the space below…
A:
Q: Use the statement, if p(E) = a/b, then o(E) = a:(b - a) and o(E') = (b- a):a, %3D to find the odds…
A: No. of cards in a full deck=52 No. of hearts=13 No. of clubs=13 No. of spade=13 No. of diamond=13
Q: An article in the Journal of the American Ceramic Society, "Rapid Hot-Pressing of Ultrafine PSZ…
A: For the given data Intercept = ?
Q: ng dangerous additives like Vitamin E acetate in vaping products. The CDC took a sample of 37 vaping…
A: We have given that, Sample size (n) = 37 and favorable cases (X) = 17 Then, We will find the 90%…
Q: According to ongoing clinical research into feline health, the weight of an obese adult male…
A:
Q: Let A={1,2,3} and B={2,3,5,6,7} and the universal set is U = {1,2,3,4,5,6,7,8,9,10}. Which of the…
A: Given that, A={1,2,3} and B={2,3,5,6,7} U={1,2,3,4,5,6,7,8,9,10}
Q: n(A) = 20, n(B) = 20, n(C) = 29, n(B ∩ C) = 8, n(S) = 51 Figure Description A Venn diagram has three…
A: Given that n(A) = 20, n(B) = 20, n(C) = 29, n(B ∩ C) = 8, n(S) = 51 4 is inside A and B and…
Q: The values in the following matrix are treatment means from a two-factor study. Wh B1 B2 A1 10 1 A2…
A:
Q: mes required by three workers to perform an assembly-line task were recorded on five randomly Eed…
A:
Q: Twin Births Twin Births 1995-1997 (In Thousands) Term or Preterm with Preterm without procedures 14…
A: Given that - A medical publication published a study that examined pregnancies that resulted in the…
Q: Please answer question with details on how to do it. Thank you. 8.) Daily travel times (in…
A: Given mean of 130 Standard deviation of 17.
Q: A study was designed to compare the smoking habits of married men with those married women. A…
A:
Q: 1. A researcher wants to determine if the number of hours spent studying statistics is correlated…
A: Given that, a researcher wants to determine if the number of hours spent studying statistics is…
Q: Which of the following is the correct formula for the margin of error of a proportion? EBM…
A: Here we have to identify the correct formula for margin of error of a proportion
Q: Example 21.3 A group of volunteers of a service organisation raise money each year by selling gift…
A:
Q: If three balls are randomly selected one at a time without replacement, how many different…
A: A bag contains 6 different balls that are alike except for color. The colors are red, white, blue,…
Q: 3. In early April, about 14% of San Diego tested positive for Coronavirus. We randomly selected 300…
A: Given,population proportion(P)=0.14sample size(n)=300and X=60α=0.01 Sample proportion(p^)=XnSample…
Q: The z-score of −2 tells us that x=14 is two standard deviations to the left of the mean. The…
A: Given that z score is -2. x=14 is two standard deviations to the left of the mean. That is, μ-2σ.…
Q: From the data we find that Sxx = 0.11273, Syy 11,807,324,805, Sxy = 34,422.28. n=29, test the null…
A: Find the Correlation Coefficient for given data
Q: The variables X & Y have a negative correlation of -.70, therefore you could predict that A. None…
A: From the provided information, The variables X & Y have a negative correlation of -0.70.
Q: Assume that a sample is used to estimate a population proportion p. Find the 98% confidence interval…
A:
Q: What would you use to determine whether significant differences exist between all levels of your…
A: We have to choose correct option. Which is best to determine whether significant differences exist…
Q: marginal change and an ordered pair are given. b = 2, (5, 3) Write the equation of the line in…
A:
Q: For items number 2 through number 4, find the equation of the regression line and find the y value…
A: Q2 X-Oil Y-Gasoline Regression equation X=60 Y'=1.956+0.000896*60 Y'=2.01
Q: The following statistics represent crime rates per 1000 population for a random sample of 46 Denver…
A:
Q: (b) Select all the violated Nelson rules (if any) below. O A. Eight points in a row occur beyond…
A:
Q: What is the confidence interval estimate of the population mean p? (Round to three decimal places as…
A: Data set include 103 body temperature; n=103 x¯=98.5s=0.61
Q: Example 19.1 is 20 against the alternative hypothesis u # 20. Fifteen observations were taken and…
A:
Q: Which are more informative confidence intervals or significance tests? A. Confidence…
A: According to the given information in this question We need to identify which confidence intervals…
Q: Example 20.7 The price and quantity data for two years for five commodities are given below;…
A:
Q: A psychologist is interested in constructing a 99% confidence interval for the proportion of people…
A: Solution-: Given: n=705,X=56,α=0.01 We want to find, (a) With 99% confidence the proportion of all…
Q: 1. Find the regression equation. 2. Make a forecast of the number of dropouts in SY 2013 - 2014. 3.…
A: When we want to predict the value of one variable, say y, from the given value of another variable,…
Q: Example 19.1 is 20 against the alternative hypothesis µ ± 20. Fifteen observations were taken and…
A:
Q: A USA Today/CNN/Gallup survey of 374 working parents found 203 who said they spend too little time…
A:
Q: experimental procedure. The known (NO3-) for NX is 4.60 mg/L. Which t-test should be used to…
A:
Q: • Enumerate and differentiate the four levels of measurement in statistics.
A: "Since you have asked multiple question ,we will solve the first question for you .If you want any…
Q: What does rejection of Ho: p = 0 imply for the regression equation ŷ = bo + bịx? Explain in 1 - 2…
A:
Q: For the given data, (a) find the test statistic, (b) find the standardized test statistic, (c)…
A: Given that,
Q: Statistics used to test for significance and extrapolate to a population are known as what type of…
A: Statistics is basically divided into two major fields. Descriptive statistics Inferential…
Q: Identify the following: a.) Type of Test b.) Test Static c.) Degrees of Freedom d.) Computed…
A:


Trending now
This is a popular solution!

Step by step
Solved in 2 steps with 3 images

- An article in the Journal of Applied Polymer Science (Vol. 56, pp. 471–476, 1995) studied the effect of the mole ratio of sebacic acid on the intrinsic viscosity of copolyesters.- The data follows: Viscosity 0.45 0.2 0.34 0.58 0.7 0.57 0.55 0.44 Mole ratio 1 0.9 0.8 0.7 0.6 0.5 0.4 0.3 (a) Construct a scatter diagram of the data.A number of studies have shown lichens (certain plants composed of an alga and a fungus) to be excellent bioindicators of air pollution. The article “The Epiphytic Lichen Hypogymnia physodes as a Biomonitor of Atmospheric Nitrogen and Sulphur Deposition in Norway” (Environ. Monitoring Assessment, 1993: 27–47) gives the following data (read from a graph) on x ¼ NO3 wet deposition (g N/m2 ) and y ¼ lichen N (% dry weight): (refer to chart) The author used simple linear regression to analyze the data. Use the accompanying MINITAB output to answer the following questions: a. What are the least squares estimates of b0 and b1? b. Predict lichen N for an NO3 deposition value of .5. c. What is the estimate of s? d. What is the value of total variation, and how much of it can be explained by the model relationship?The following partial JMP regression output for the Fresh detergent data relates to predicting demand for future sales periods in which the price difference will be .10. SE Fit = .165360573, s = .628152. Predicted Demand Lower 95% MeanDemand Upper 95% MeanDemand 31 8.181072245 7.842346262 8.519798229 StdErr IndivDemand Lower 95% IndivDemand Upper 95% MeanDemand 0.649552965 6.850522511 9.511621980 Click here for the Excel Data File (a) Report a point estimate of and a 95 percent confidence interval for the mean demand for Fresh in all sales periods when the price difference is .10. (Round your CI answers to 3 decimal places and other answer to 4 decimal places.) (b) Report a point prediction of and a 95 percent prediction interval for the actual demand for Fresh in an individual sales period when the price difference is .10. (Round your PI answers to 3 decimal places and other answer to 4 decimal places.) (c) StdErr Indiv Demand on…
- Snowpacks contain a wide spectrum of pollutants thatmay represent environmental hazards. The article“Atmospheric PAH Deposition: Deposition Velocitiesand Washout Ratios” (J. of EnvironmentalEngineering, 2002: 186–195) focused on the depositionof polyaromatic hydrocarbons. The authors proposeda multiple regression model for relating depositionover a specified time period (y, in mg/m2) to tworather complicated predictors x1 (mg-sec/m3) and x2 (mg/m2), defined in terms of PAH air concentrations forvarious species, total time, and total amount of precipitation.Here is data on the species fluoranthene andcorresponding Minitab output:obs x1 x2 flth1 92017 .0026900 278.782 51830 .0030000 124.533 17236 .0000196 22.654 15776 .0000360 28.685 33462 .0004960 32.666 243500 .0038900 604.707 67793 .0011200 27.698 23471 .0006400 14.189 13948 .0004850 20.6410 8824 .0003660 20.6011 7699 .0002290 16.6112 15791 .0014100 15.0813 10239 .0004100 18.0514 43835 .0000960 99.7115 49793 .0000896 58.9716 40656…An article in the ASCE Journal of Energy Engineering [“Overview of Reservoir Release Improvements at 20 TVA Dams” (Vol. 125, April 1999, pp. 1–17)] presents data on dissolved oxygen concentrations in streams below 20 dams in the Tennessee Valley Authority system. The observations are (in milligrams per liter):The table below shows (lifetime) peptic ulcer rates (per 100 population), UU, for various family incomes, xx, as reported by the 1989 National Health Interview Survey. Income 4000 6000 8000 12000 16000 20000 30000 45000 60000 Ulcer rate 14.1 13.1 13.8 12.6 11.8 11.7 11.5 9.3 7.6 (a) Find the equation of the regression line. Ulcer rate, U(x)= . (b) Estimate the peptic ulcer rate for an income level of x0= 25000 according to the linear model in part (a). Ulcer rate, U(x0)= .
- A researcher hypothesizes that in a certain country the net annual growth of private sector purchases of government bonds, B, is positively related to the nominal rate of interest on the bonds, NI, and negatively related to the rate of inflation Π: Bt = a0 + a1NIt + a2Π t + ut Note that it may be hypothesized that B depends on the real rate of interest on bonds, R, where R = NI – Π. Using a sample of 56 annual observations, s/he estimates the following equations: (1) Bt = 0.43 + 0.90NIt - 0.97Πt R21 = 0.962, SSR1 = 2.20, QRESET(F1,52) = 16.6 (3.58) (8.80) (-1.05) (2) Bt = 0.44 + 0.94Rt R22 = 0.960, SSR2 = 2.22, QRESET(F1,53) = 0.9 (9.70) (16.7) (3) Bt = 0.44 + 1.14NIt SSR3 = 9.20, QRESET(F1,53) = 59.9 (8.84) (36.1) (4) NIt = 0.08 + 0.94Πt R24 = 0.997, SSR4 = 0.18, QRESET(F1,53) = 1.4…Below you are given a partial Excel output based on a sample of 16 observations. ANOVA df SS MS F Regression 4,853 2,426.5 Residual 485.3 Coefficients Standard Error Intercept 12.924 4.425 x1 -3.682 2.630 x2 45.216 12.560 The interpretation of the coefficient of x1 is that _____. a. a one-unit increase in x1 will lead to a 3.682-unit decrease in y when all other variables are held constant b. a on-unit increase in x1 will lead to a 3.682-unit decrease in x2 when all other variables are held constant c. It is impossible to interpret the coefficient. d. a one-unit change in x1 will lead to a 3.682-unit decrease in yShown below is a portion of a computer output for a linear regression analysis relating an individual's income (y in thousands of dollars) to age (x1 in years), level of education (x2 ranging from 1 to 5), and the individual's gender (x3 where 0 = female and 1 = male). Coefficient Standard Error t-statistic p-value Intercept 15.934 1.389 11.47 0.000 x1 0.625 0.094 6.65 0.000 x2 0.921 0.190 4.85 0.000 x3 –0.510 0.920 –0.55 0.590 Source of Variation Sum of squares Degrees of freedom Mean square F-statistic p-value Regression 84 3 28 4 0.027 Error 112 16 7 Total 196 19 a. Is there a significant relationship between an individual's income and the set of variables, age, level of education, and gender (based on a significance level α =05 )? Explain why using one of the p-values in the output tables. b.Which of the three predictor variables are…
