An article in the Tappi Journal (March, 1986) presented data on green liquor Na2S concentration (in grams per liter) that is affected by paper machi production (in tons per day). 18. What is the significant level (in %)?
An article in the Tappi Journal (March, 1986) presented data on green liquor Na2S concentration (in grams per liter) that is affected by paper machi production (in tons per day). 18. What is the significant level (in %)?

Glencoe Algebra 1, Student Edition, 9780079039897, 0079039898, 2018
18th Edition
ISBN:9780079039897
Author:Carter
Publisher:Carter
Chapter4: Equations Of Linear Functions
Section4.5: Correlation And Causation
Problem 2AGP

Related questions
Question
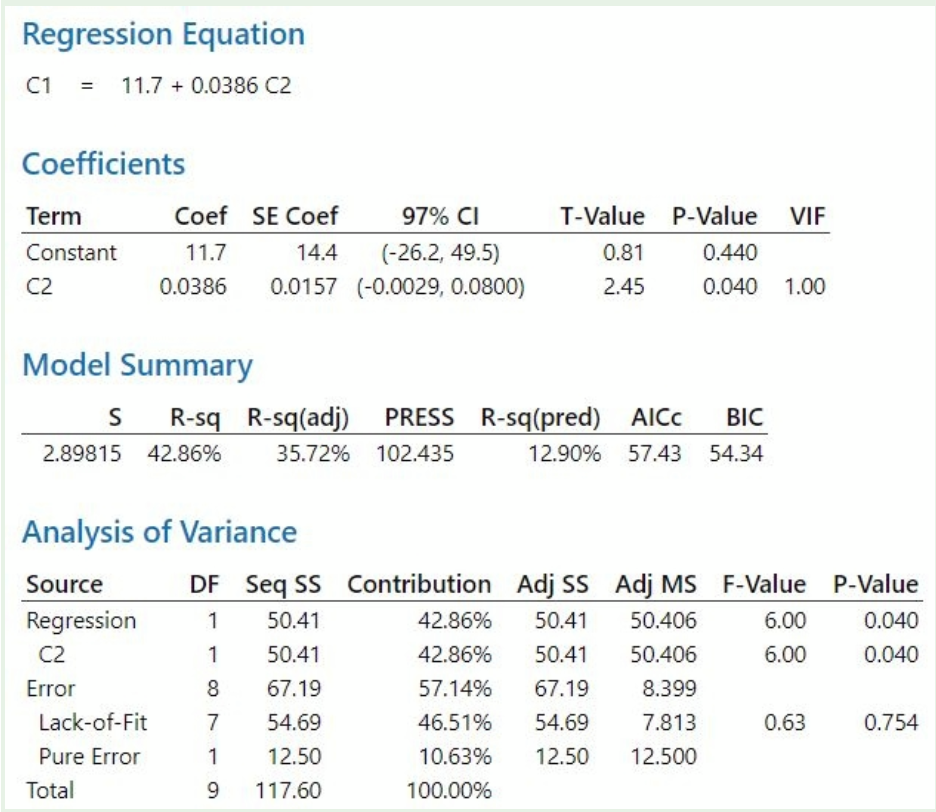
18. Using the given Minitab output, answer the questions that follow.

Transcribed Image Text:An article in the Tappi Journal (March, 1986) presented data on green liquor Na2S concentration (in grams per liter) that is affected by paper machine
production (in tons per day).
18. What is the significant level (in %)?
Transcribed Image Text:Regression Equation
C1 = 11.7 + 0.0386 C2
Coefficients
Term
Coef SE Coef
97% CI
T-Value P-Value VIF
Constant
11.7
14.4
(-26.2, 49.5)
0.81
0.440
C2
0.0386
0.0157 (-0.0029, 0.0800)
2.45
0.040 1.00
Model Summary
S
R-sq R-sq(adj)
PRESS R-sq(pred) AICC
BIC
2.89815 42.86%
35.72% 102.435
12.90% 57.43 54.34
Analysis of Variance
Source
DF Seq SS Contribution Adj SS Adj MS F-Value P-Value
Regression
C2
1
50.41
42.86%
50.41
50.406
6.00
0.040
1
50.41
42.86%
50.41
50.406
6.00
0.040
Error
8
67.19
57.14%
67.19
8.399
Lack-of-Fit
7
54.69
46.51%
54.69
7.813
0.63
0.754
Pure Error
1
12.50
10.63%
12.50
12.500
Total
9.
117.60
100.00%
Expert Solution
This question has been solved!
Explore an expertly crafted, step-by-step solution for a thorough understanding of key concepts.

Step by step
Solved in 2 steps with 2 images

Recommended textbooks for you
Glencoe Algebra 1, Student Edition, 9780079039897…
Algebra
ISBN:
9780079039897
Author:
Carter
Publisher:
McGraw Hill

College Algebra (MindTap Course List)
Algebra
ISBN:
9781305652231
Author:
R. David Gustafson, Jeff Hughes
Publisher:
Cengage Learning
Glencoe Algebra 1, Student Edition, 9780079039897…
Algebra
ISBN:
9780079039897
Author:
Carter
Publisher:
McGraw Hill
College Algebra (MindTap Course List)
Algebra
ISBN:
9781305652231
Author:
R. David Gustafson, Jeff Hughes
Publisher:
Cengage Learning