An article in the San Jose Mercury News stated that students in the California state university system take 4.5 years, on average, to finish their undergraduate degrees. Suppose you believe that the mean time is longer. You conduct a survey of 42 students and obtain a sample mean of 5.1 with a sample standard deviation of 1.2. Do the data support your claim at the 1% level?
An article in the San Jose Mercury News stated that students in the California state university system take 4.5 years, on average, to finish their undergraduate degrees. Suppose you believe that the mean time is longer. You conduct a survey of 42 students and obtain a sample mean of 5.1 with a sample standard deviation of 1.2. Do the data support your claim at the 1% level?

Chapter9: Sequences, Probability And Counting Theory
Section9.7: Probability
Problem 1SE: What term is used to express the likelihood of an event occurring? Are there restrictions on its...

Related questions
Question
An article in the San Jose Mercury News stated that students in the California state university system take 4.5 years, on average, to finish their undergraduate degrees. Suppose you believe that the
Note: If you are using a Student's t-distribution for the problem, you may assume that the underlying population is
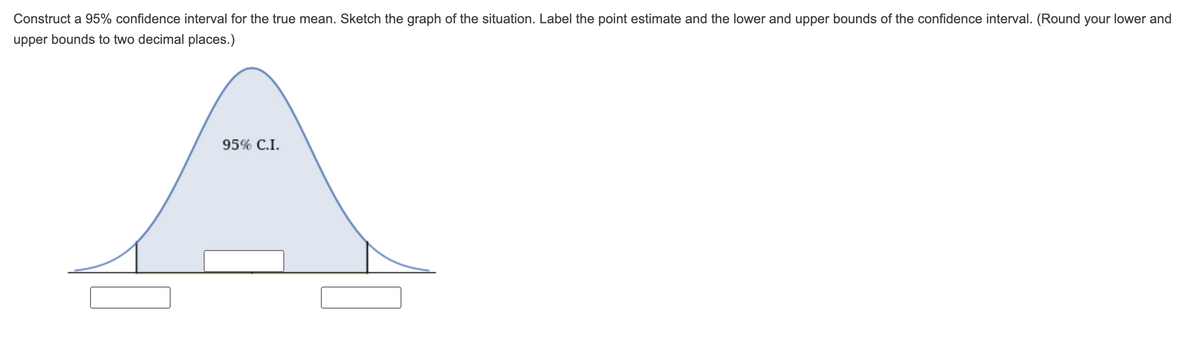
Transcribed Image Text:Construct a 95% confidence interval for the true mean. Sketch the graph of the situation. Label the point estimate and the lower and upper bounds of the confidence interval. (Round your lower and
upper bounds to two decimal places.)
95% C.I.
Expert Solution
This question has been solved!
Explore an expertly crafted, step-by-step solution for a thorough understanding of key concepts.

This is a popular solution!

Trending now
This is a popular solution!

Step by step
Solved in 4 steps

Recommended textbooks for you