Suppose that you have several hypotheses to test, as follow: H1: Costumer focus has a significant positive relationship with organization performance. H2: Continuous improvement has a significant negative relationship with organization performance. H3: Employee involvement has a significant negative relationship with organization performance. H4: Top management support has a significant positive relationship with organization performance. H5: Supplier management has a significant positive relationship with organization performance. After you analyze the data using linear regression analysis, the result showed as follow: MODEL SUMMARY Model R R Square Adjusted R Square Std. Error of the Estimate 1 .674a 0.579 0.467 0.833 ANNOVA Model Sum of Squares df Mean Square F Sig. Regression 85.400 6 13.673 23.547 .000b Residual 140.500 195 .695 Total 218.500 198 a. Dependent Variable: Organization Performance b. Predictors: (Constant), Customer focus, Continuous Improvement, Employee Involvement, Top Management, Supplier Management Coefficients Model Unstandardized Coefficients Standardized Coefficients t sig. 1 B Std. Error Beta Constant) 1.847 .659 2.805 .006 Costumer Focus .130 .146 .117 .893 .373 Continuous Improvement -.301 .077 -.3989 -3.896 .076 Employee Involvement -.240 .112 -.338 -4.355 .004 Top Management .211 .083 .138 3.330 .006 Supplier Management .225 .089 .278 2.513 .013 Questions: a. Are the hypotheses supported (H1, H2, H3, H4, H5)? Provide your explanation. b. What is the meaning of R Square (R2) = 0.579? c. Which independent variables have the highest impact on the dependent variable? Explain how you arrived at your conclusion.
Suppose that you have several hypotheses to test, as follow:
H1: Costumer focus has a significant positive relationship with organization performance.
H2: Continuous improvement has a significant negative relationship with organization performance.
H3: Employee involvement has a significant negative relationship with organization performance.
H4: Top management support has a significant positive relationship with organization performance.
H5: Supplier management has a significant positive relationship with organization performance.
After you analyze the data using linear
| MODEL SUMMARY | ||||
| Model | R | R Square | Adjusted R Square | Std. Error of the Estimate |
| 1 | .674a | 0.579 | 0.467 | 0.833 |
| ANNOVA | |||||
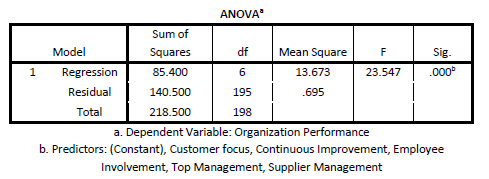
| Model | Sum of Squares | df | Mean Square | F | Sig. |
| Regression | 85.400 | 6 | 13.673 | 23.547 | .000b |
| Residual | 140.500 | 195 | .695 | ||
| Total | 218.500 | 198 |
a. Dependent Variable: Organization Performance
b. Predictors: (Constant), Customer focus, Continuous Improvement, Employee Involvement, Top Management, Supplier Management
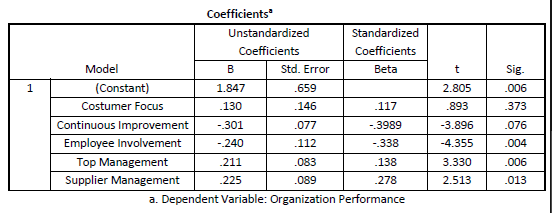
| Coefficients | ||||||
| Model | Unstandardized Coefficients |
Standardized Coefficients |
t | sig. | ||
| 1 | B | Std. Error | Beta | |||
| Constant) | 1.847 | .659 | 2.805 | .006 | ||
| Costumer Focus | .130 | .146 | .117 | .893 | .373 | |
| Continuous Improvement | -.301 | .077 | -.3989 | -3.896 | .076 | |
| Employee Involvement | -.240 | .112 | -.338 | -4.355 | .004 | |
| Top Management | .211 | .083 | .138 | 3.330 | .006 | |
| Supplier Management | .225 | .089 | .278 | 2.513 | .013 |
Questions:
a. Are the hypotheses supported (H1, H2, H3, H4, H5)? Provide your explanation.
b. What is the meaning of R Square (R2) = 0.579?
c. Which independent variables have the highest impact on the dependent variable? Explain how you arrived at your conclusion.


Step by step
Solved in 3 steps


