An engineer wants to determine how the weight of a car, x, affects gas mileage, y (MPG). The following data represent the weights of various cars and their miles per gallon. Make a scatter plot. (Carefully choose units on both axes; no need to start at 0, but make them not too small! Do not omit axis labels and the title.) Describe the relationship between Car Weight and MPG. Justify. Give the correlation coefficient to three decimal places. (CV are listed on the last page) Car Weight (pounds), x Miles per Gallon, y A B C D E 2750 2940 3265 3765 4120 25.4 25.1 25.4 19.8 20.2 'f it makes sense, give the equation of the regression line (of MPG on pounds of weight; use at least 3 significant, nonzero, digits) and draw this line on the plot (be precise! use a ruler.)
An engineer wants to determine how the weight of a car, x, affects gas mileage, y (MPG). The following data represent the weights of various cars and their miles per gallon. Make a scatter plot. (Carefully choose units on both axes; no need to start at 0, but make them not too small! Do not omit axis labels and the title.) Describe the relationship between Car Weight and MPG. Justify. Give the correlation coefficient to three decimal places. (CV are listed on the last page) Car Weight (pounds), x Miles per Gallon, y A B C D E 2750 2940 3265 3765 4120 25.4 25.1 25.4 19.8 20.2 'f it makes sense, give the equation of the regression line (of MPG on pounds of weight; use at least 3 significant, nonzero, digits) and draw this line on the plot (be precise! use a ruler.)

College Algebra
7th Edition
ISBN:9781305115545
Author:James Stewart, Lothar Redlin, Saleem Watson
Publisher:James Stewart, Lothar Redlin, Saleem Watson
Chapter9: Counting And Probability
Section9.4: Expected Value
Problem 20E

Related questions
Question
Hi! I pretty much don't understand these problems that were presented on my Statistics class
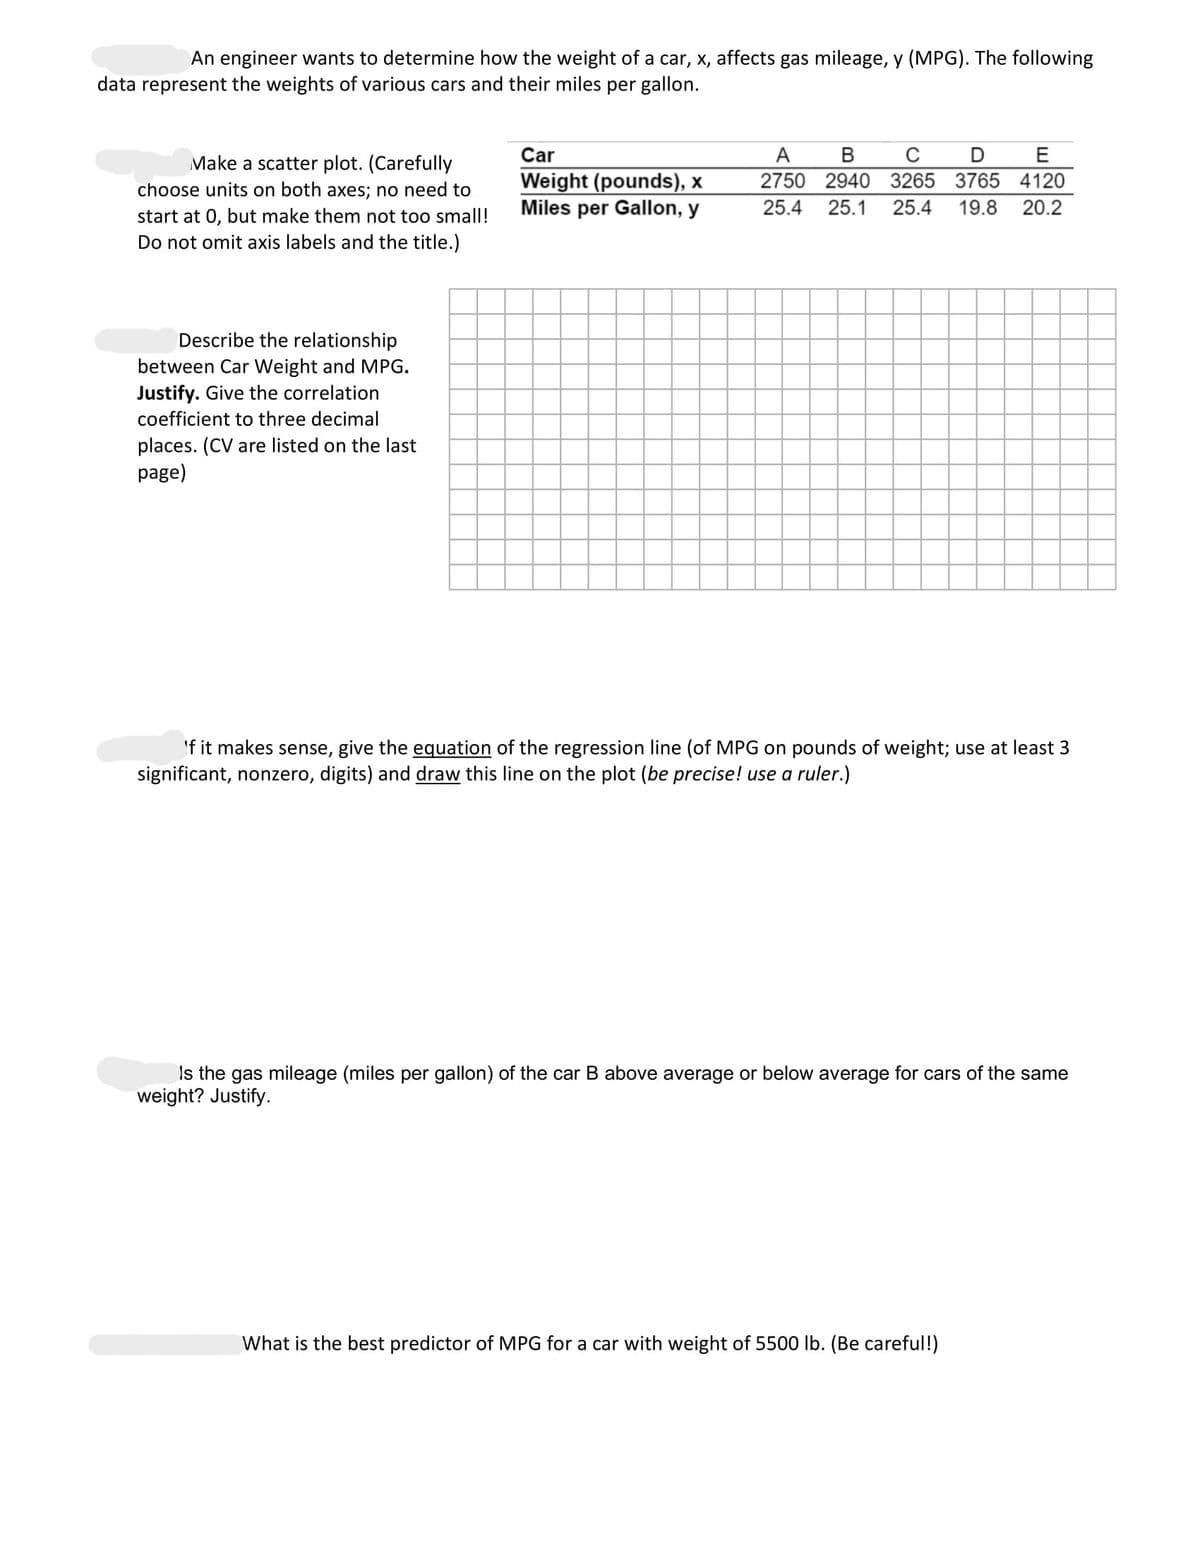
Transcribed Image Text:An engineer wants to determine how the weight of a car, x, affects gas mileage, y (MPG). The following
data represent the weights of various cars and their miles per gallon.
Make a scatter plot. (Carefully
choose units on both axes; no need to
start at 0, but make them not too small!
Do not omit axis labels and the title.)
Describe the relationship
between Car Weight and MPG.
Justify. Give the correlation
coefficient to three decimal
places. (CV are listed on the last
page)
Car
Weight (pounds), x
Miles per Gallon, y
A B C D E
2750 2940 3265 3765 4120
25.4 25.1 25.4 19.8 20.2
If it makes sense, give the equation of the regression line (of MPG on pounds of weight; use at least 3
significant, nonzero, digits) and draw this line on the plot (be precise! use a ruler.)
Is the gas mileage (miles per gallon) of the car B above average or below average for cars of the same
weight? Justify.
What is the best predictor of MPG for a car with weight of 5500 lb. (Be careful!)
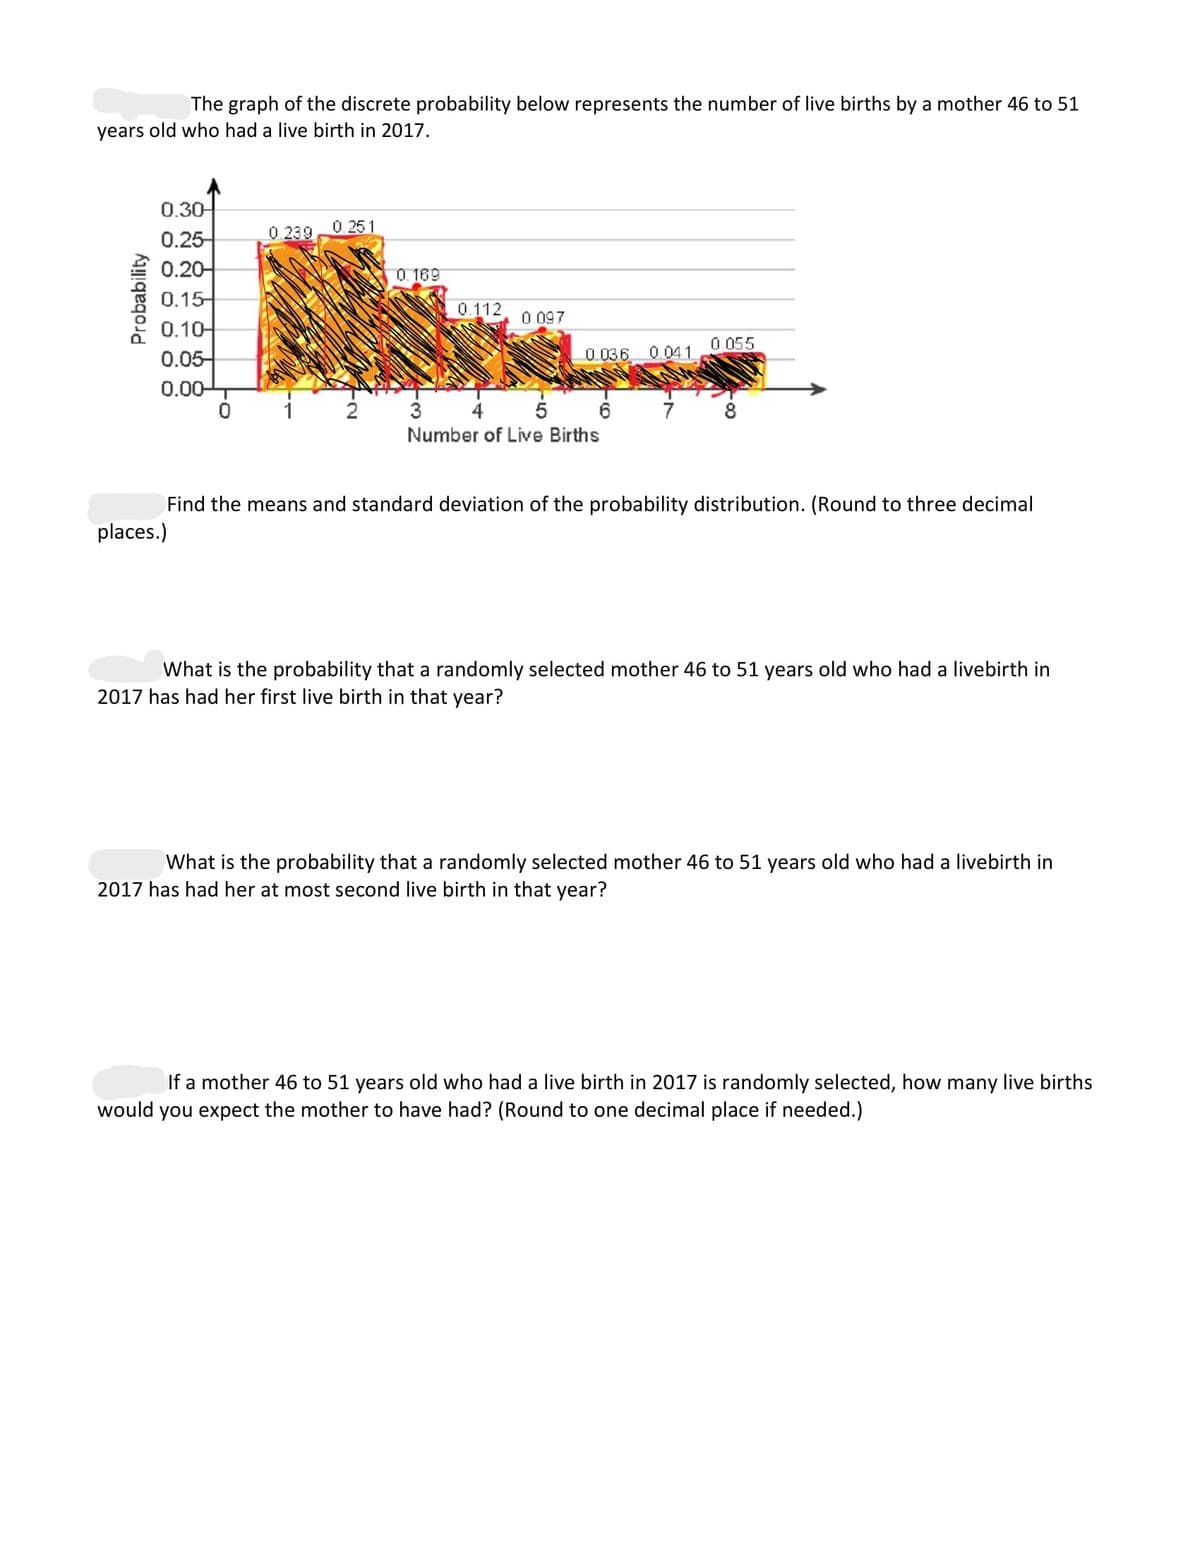
Transcribed Image Text:The graph of the discrete probability below represents the number of live births by a mother 46 to 51
years old who had a live birth in 2017.
Probability
0.30-
0.25-
0.20-
0.15
0.10
0.05-
0.00-
0
places.)
0.239
0.251
0.169
0.112
0.097
0.036 0.041
3
5
Number of Live Births
0.055
8
Find the means and standard deviation of the probability distribution. (Round to three decimal
What is the probability that a randomly selected mother 46 to 51 years old who had a livebirth in
2017 has had her first live birth in that year?
What is the probability that a randomly selected mother 46 to 51 years old who had a livebirth in
2017 has had her at most second live birth in that year?
If a mother 46 to 51 years old who had a live birth in 2017 is randomly selected, how many live births
would you expect the mother to have had? (Round to one decimal place if needed.)
Expert Solution
This question has been solved!
Explore an expertly crafted, step-by-step solution for a thorough understanding of key concepts.

This is a popular solution!

Trending now
This is a popular solution!

Step by step
Solved in 4 steps with 2 images

Recommended textbooks for you
College Algebra
Algebra
ISBN:
9781305115545
Author:
James Stewart, Lothar Redlin, Saleem Watson
Publisher:
Cengage Learning

Algebra and Trigonometry (MindTap Course List)
Algebra
ISBN:
9781305071742
Author:
James Stewart, Lothar Redlin, Saleem Watson
Publisher:
Cengage Learning

College Algebra (MindTap Course List)
Algebra
ISBN:
9781305652231
Author:
R. David Gustafson, Jeff Hughes
Publisher:
Cengage Learning
College Algebra
Algebra
ISBN:
9781305115545
Author:
James Stewart, Lothar Redlin, Saleem Watson
Publisher:
Cengage Learning
Algebra and Trigonometry (MindTap Course List)
Algebra
ISBN:
9781305071742
Author:
James Stewart, Lothar Redlin, Saleem Watson
Publisher:
Cengage Learning
College Algebra (MindTap Course List)
Algebra
ISBN:
9781305652231
Author:
R. David Gustafson, Jeff Hughes
Publisher:
Cengage Learning

Algebra & Trigonometry with Analytic Geometry
Algebra
ISBN:
9781133382119
Author:
Swokowski
Publisher:
Cengage