An engineer wants to determine the effectiveness of a safety program. He collects annual loss of hours due to accidents in 12 plants before and after the program was put into operation. After 112 Plant Before 129 Plant Before 95 After 99 7 2 116 117 103 104 8 99 71 3 79 82 4 109 88 10 64 79 5 77 75 11 68 65 6. 98 86 12 107 100 E Click here for the Excel Data File Let the difference be defined as Before - After. a. Specify the competing hypotheses that determine whether the safety program was effective. O Ho: HD= 0; HA Ho#0 O Ho: HDS0; HA: HD>O O Ho: HDZ 0; HA HD
An engineer wants to determine the effectiveness of a safety program. He collects annual loss of hours due to accidents in 12 plants before and after the program was put into operation. After 112 Plant Before 129 Plant Before 95 After 99 7 2 116 117 103 104 8 99 71 3 79 82 4 109 88 10 64 79 5 77 75 11 68 65 6. 98 86 12 107 100 E Click here for the Excel Data File Let the difference be defined as Before - After. a. Specify the competing hypotheses that determine whether the safety program was effective. O Ho: HD= 0; HA Ho#0 O Ho: HDS0; HA: HD>O O Ho: HDZ 0; HA HD

Glencoe Algebra 1, Student Edition, 9780079039897, 0079039898, 2018
18th Edition
ISBN:9780079039897
Author:Carter
Publisher:Carter
Chapter10: Statistics
Section10.5: Comparing Sets Of Data
Problem 14PPS

Related questions
Question
| Plant | Before | After |
| 1 | 129 | 112 |
| 2 | 116 | 103 |
| 3 | 117 | 104 |
| 4 | 109 | 88 |
| 5 | 77 | 75 |
| 6 | 98 | 86 |
| 7 | 95 | 99 |
| 8 | 99 | 71 |
| 9 | 79 | 82 |
| 10 | 64 | 79 |
| 11 | 68 | 65 |
| 12 | 107 | 100 |
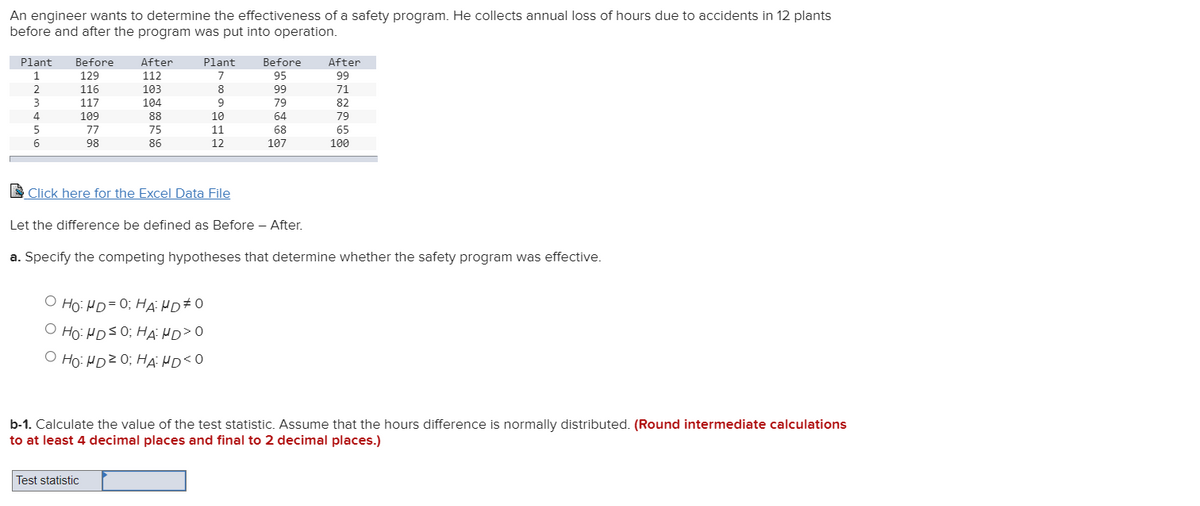
Transcribed Image Text:An engineer wants to determine the effectiveness of a safety program. He collects annual loss of hours due to accidents in 12 plants
before and after the program was put into operation.
TTTI
Plant
Before
After
Plant
Before
After
1
129
112
7
95
99
2
116
103
8
99
71
3
117
104
9
79
82
4
109
88
10
64
79
5
77
75
11
68
65
98
86
12
107
100
E Click here for the Excel Data File
Let the difference be defined as Before – After.
a. Specify the competing hypotheses that determine whether the safety program was effective.
O Ho: HD= 0; HA: HD#O
Ho: HDS 0; HAi HD>0
O Ho: HDZ 0; HA HD<O
b-1. Calculate the value of the test statistic. Assume that the hours difference is normally distributed. (Round intermediate calculations
to at least 4 decimal places and final to 2 decimal places.)
Test statistic
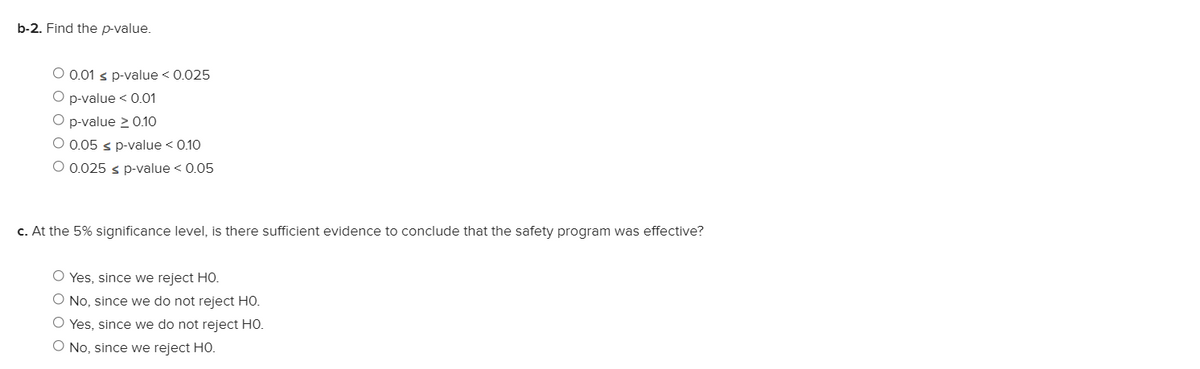
Transcribed Image Text:b-2. Find the p-value.
O 0.01 s p-value < 0.025
O p-value < 0.01
O p-value 2 0.10
O 0.05 s p-value < 0.10
O 0.025 s p-value < 0.05
c. At the 5% significance level, is there sufficient evidence to conclude that the safety program was effective?
O Yes, since we reject HO.
O No, since we do not reject HO.
Yes, since we do not reject HO.
O No, since we reject HO.
Expert Solution
This question has been solved!
Explore an expertly crafted, step-by-step solution for a thorough understanding of key concepts.

This is a popular solution!

Trending now
This is a popular solution!

Step by step
Solved in 2 steps with 2 images

Recommended textbooks for you
Glencoe Algebra 1, Student Edition, 9780079039897…
Algebra
ISBN:
9780079039897
Author:
Carter
Publisher:
McGraw Hill
Glencoe Algebra 1, Student Edition, 9780079039897…
Algebra
ISBN:
9780079039897
Author:
Carter
Publisher:
McGraw Hill