Samples of emissions from three suppliers are classified for conformance to air-quality specifications. The results are summarized as follows: Conforms to air-quality YES NO A 24 9 Supplier B 24 14 30 8 How many emissions are examined in this study?
Samples of emissions from three suppliers are classified for conformance to air-quality specifications. The results are summarized as follows: Conforms to air-quality YES NO A 24 9 Supplier B 24 14 30 8 How many emissions are examined in this study?

Holt Mcdougal Larson Pre-algebra: Student Edition 2012
1st Edition
ISBN:9780547587776
Author:HOLT MCDOUGAL
Publisher:HOLT MCDOUGAL
Chapter11: Data Analysis And Probability
Section11.5: Interpreting Data
Problem 1C

Related questions

Question
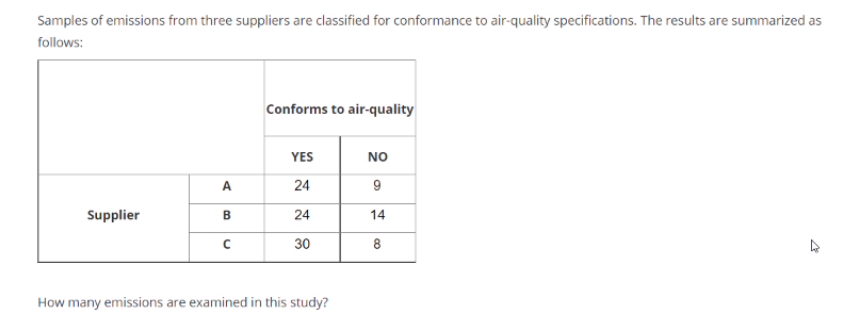
Transcribed Image Text:Samples of emissions from three suppliers are classified for conformance to air-quality specifications. The results are summarized as
follows:
Conforms to air-quality
YES
NO
A
24
9
Supplier
B
24
14
30
8
How many emissions are examined in this study?
Expert Solution
This question has been solved!
Explore an expertly crafted, step-by-step solution for a thorough understanding of key concepts.

This is a popular solution!

Trending now
This is a popular solution!

Step by step
Solved in 2 steps with 1 images

Knowledge Booster


Learn more about
Need a deep-dive on the concept behind this application? Look no further. Learn more about this topic, statistics and related others by exploring similar questions and additional content below.Recommended textbooks for you
Holt Mcdougal Larson Pre-algebra: Student Edition…
Algebra
ISBN:
9780547587776
Author:
HOLT MCDOUGAL
Publisher:
HOLT MCDOUGAL

College Algebra (MindTap Course List)
Algebra
ISBN:
9781305652231
Author:
R. David Gustafson, Jeff Hughes
Publisher:
Cengage Learning
Holt Mcdougal Larson Pre-algebra: Student Edition…
Algebra
ISBN:
9780547587776
Author:
HOLT MCDOUGAL
Publisher:
HOLT MCDOUGAL
College Algebra (MindTap Course List)
Algebra
ISBN:
9781305652231
Author:
R. David Gustafson, Jeff Hughes
Publisher:
Cengage Learning