An epidemic of influenza spreads through a city. The accompanying figure is the graph of I = f(w),where / is the number of individuals (in thousands) infected w weeks after the epidemic begins. 10 S(w) 10 12 (a) Evaluatef(2). Round your answer to the nearest integer or half-integer. f(2) = (b) Approximately how many people were infected at the height of the epidemic? When did that occur? Write your answer in the form f(a) = b. Round your answers to the nearest integer or half-integer. %3D (c) Solve f(w) = 4.5. Enter your answers in increasing order. Round your answers to the nearest integer or half-integer. w%3D and w = (d) The graph used f(w) = 6w(1.25).Use the graph to estimate the solution of the inequality 6w(1.25) 2 6. That is, to evaluate the values of w when f(w) 2 6. Round your answers to the nearest integer or half-integer. w 2 and w S
An epidemic of influenza spreads through a city. The accompanying figure is the graph of I = f(w),where / is the number of individuals (in thousands) infected w weeks after the epidemic begins. 10 S(w) 10 12 (a) Evaluatef(2). Round your answer to the nearest integer or half-integer. f(2) = (b) Approximately how many people were infected at the height of the epidemic? When did that occur? Write your answer in the form f(a) = b. Round your answers to the nearest integer or half-integer. %3D (c) Solve f(w) = 4.5. Enter your answers in increasing order. Round your answers to the nearest integer or half-integer. w%3D and w = (d) The graph used f(w) = 6w(1.25).Use the graph to estimate the solution of the inequality 6w(1.25) 2 6. That is, to evaluate the values of w when f(w) 2 6. Round your answers to the nearest integer or half-integer. w 2 and w S

Glencoe Algebra 1, Student Edition, 9780079039897, 0079039898, 2018
18th Edition
ISBN:9780079039897
Author:Carter
Publisher:Carter
Chapter7: Exponents And Exponential Functions
Section7.8: Transforming Exponential Expressions
Problem 1CYU

Related questions
Question
Need it urgent
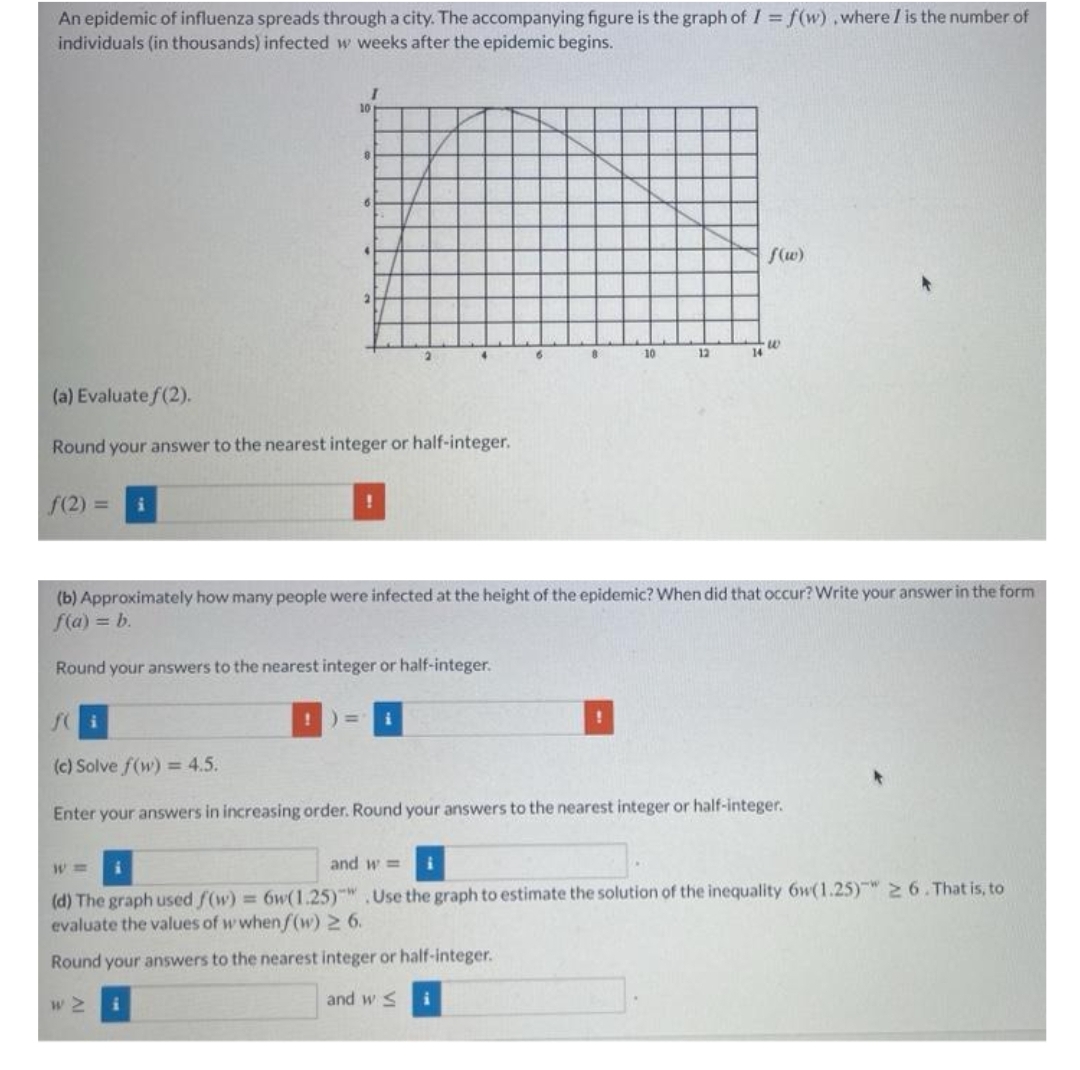
Transcribed Image Text:An epidemic of influenza spreads through a city. The accompanying figure is the graph of I = f(w),where / is the number of
individuals (in thousands) infected w weeks after the epidemic begins.
10
S(w)
10
12
14
(a) Evaluate f(2).
Round your answer to the nearest integer or half-integer.
f(2) =
(b) Approximately how many people were infected at the height of the epidemic? When did that occur? Write your answer in the form
f(a) = b.
Round your answers to the nearest integer or half-integer.
%3D
i
(c) Solve f(w) = 4.5.
Enter your answers in increasing order. Round your answers to the nearest integer or half-integer.
and w =
W3=
(d) The graph used f(w) = 6w(1.25).Use the graph to estimate the solution of the inequality 6w(1.25) 2 6. That is, to
evaluate the values of w whenf(w) 2 6.
Round your answers to the nearest integer or half-integer.
w 2
and w S
Expert Solution
This question has been solved!
Explore an expertly crafted, step-by-step solution for a thorough understanding of key concepts.

This is a popular solution!

Trending now
This is a popular solution!

Step by step
Solved in 2 steps with 2 images

Recommended textbooks for you
Glencoe Algebra 1, Student Edition, 9780079039897…
Algebra
ISBN:
9780079039897
Author:
Carter
Publisher:
McGraw Hill

Algebra & Trigonometry with Analytic Geometry
Algebra
ISBN:
9781133382119
Author:
Swokowski
Publisher:
Cengage

Glencoe Algebra 1, Student Edition, 9780079039897…
Algebra
ISBN:
9780079039897
Author:
Carter
Publisher:
McGraw Hill
Algebra & Trigonometry with Analytic Geometry
Algebra
ISBN:
9781133382119
Author:
Swokowski
Publisher:
Cengage

Elementary Linear Algebra (MindTap Course List)
Algebra
ISBN:
9781305658004
Author:
Ron Larson
Publisher:
Cengage Learning

College Algebra (MindTap Course List)
Algebra
ISBN:
9781305652231
Author:
R. David Gustafson, Jeff Hughes
Publisher:
Cengage Learning
