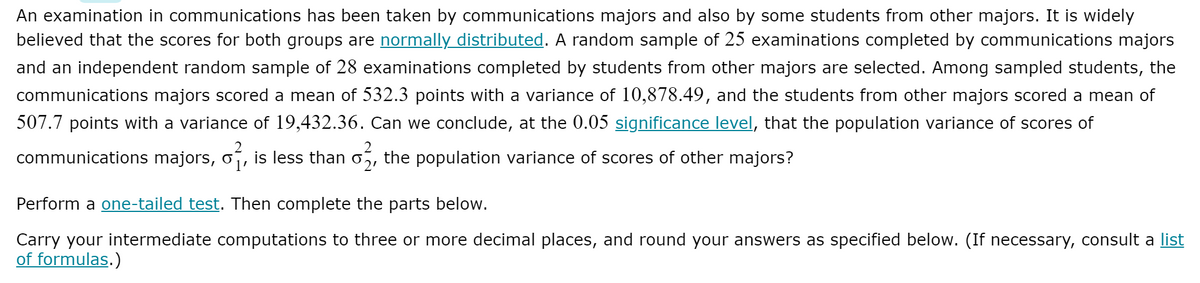
An examination in communications has been taken by communications majors and also by some students from other majors. It is widely believed that the scores for both groups are normally distributed. A random sample of 25 examinations completed by communications majors and an independent random sample of 28 examinations completed by students from other majors are selected. Among sampled students, the communications majors scored a mean of 532.3 points with a variance of 10,878.49, and the students from other majors scored a mean of 507.7 points with a variance of 19,432.36. Can we conclude, at the 0.05 significance level, that the population variance of scores of communications majors, o, is less than 0, the population variance of scores of other majors? Perform a one-tailed test. Then complete the parts below. Carry your intermediate computations to three or more decimal places, and round your answers as specified below. (If necessary, consult a list of formulas.)
An examination in communications has been taken by communications majors and also by some students from other majors. It is widely believed that the scores for both groups are normally distributed. A random sample of 25 examinations completed by communications majors and an independent random sample of 28 examinations completed by students from other majors are selected. Among sampled students, the communications majors scored a mean of 532.3 points with a variance of 10,878.49, and the students from other majors scored a mean of 507.7 points with a variance of 19,432.36. Can we conclude, at the 0.05 significance level, that the population variance of scores of communications majors, o, is less than 0, the population variance of scores of other majors? Perform a one-tailed test. Then complete the parts below. Carry your intermediate computations to three or more decimal places, and round your answers as specified below. (If necessary, consult a list of formulas.)

MATLAB: An Introduction with Applications
6th Edition
ISBN:9781119256830
Author:Amos Gilat
Publisher:Amos Gilat
Chapter1: Starting With Matlab
Section: Chapter Questions
Problem 1P

Related questions

Question
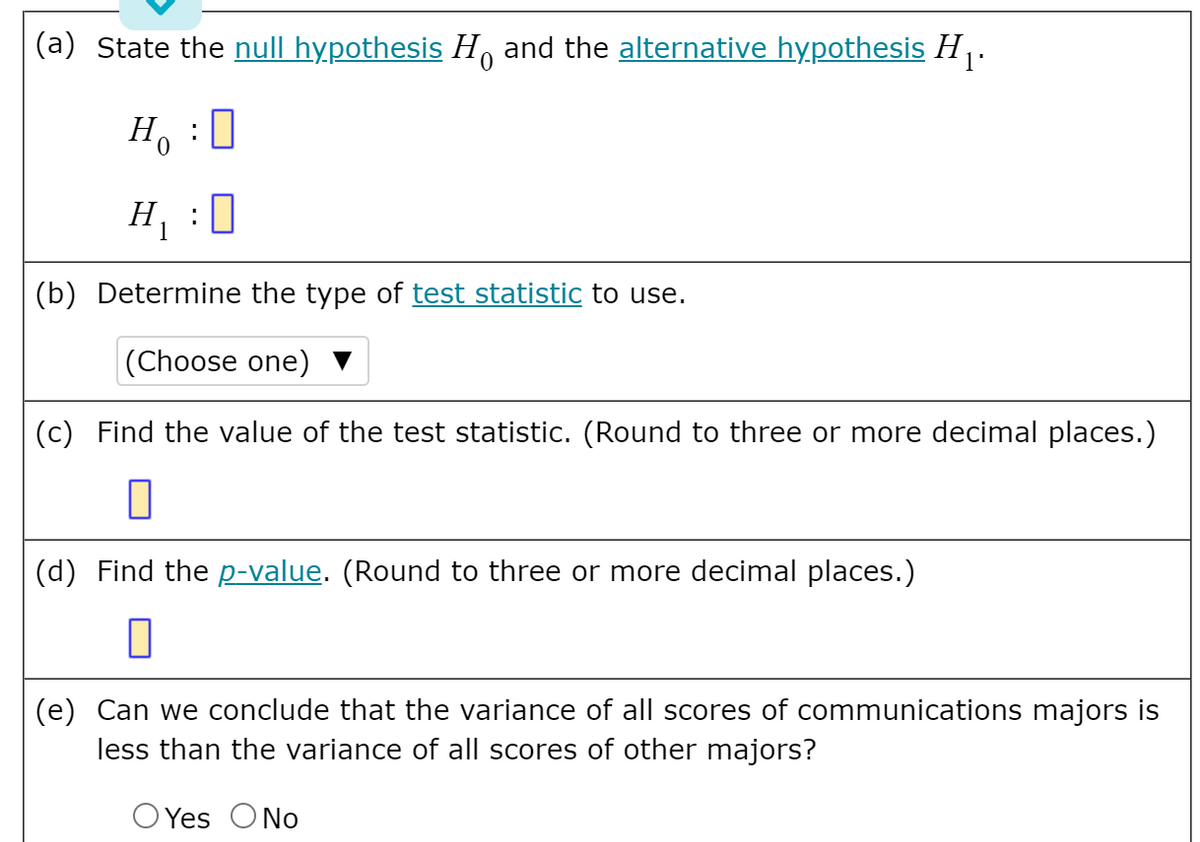
Transcribed Image Text:(a) State the null hypothesis H, and the alternative hypothesis H.
: 0
Ho
H :0
1
(b) Determine the type of test statistic to use.
|(Choose one) ▼
(c) Find the value of the test statistic. (Round to three or more decimal places.)
(d) Find the p-value. (Round to three or more decimal places.)
(e) Can we conclude that the variance of all scores of communications majors is
less than the variance of all scores of other majors?
O Yes ONo
Transcribed Image Text:An examination in communications has been taken by communications majors and also by some students from other majors. It is widely
believed that the scores for both groups are normally distributed. A random sample of 25 examinations completed by communications majors
and an independent random sample of 28 examinations completed by students from other majors are selected. Among sampled students, the
communications majors scored a mean of 532.3 points with a variance of 10,878.49, and the students from other majors scored a mean of
507.7 points with a variance of 19,432.36. Can we conclude, at the 0.05 significance level, that the population variance of scores of
communications majors, o
is less than
the population variance of scores of other majors?
1'
Perform a one-tailed test. Then complete the parts below.
Carry your intermediate computations to three or more decimal places, and round your answers as specified below. (If necessary, consult a list
of formulas.)
Expert Solution
This question has been solved!
Explore an expertly crafted, step-by-step solution for a thorough understanding of key concepts.

Step by step
Solved in 2 steps

Knowledge Booster


Learn more about
Need a deep-dive on the concept behind this application? Look no further. Learn more about this topic, statistics and related others by exploring similar questions and additional content below.Recommended textbooks for you
MATLAB: An Introduction with Applications
Statistics
ISBN:
9781119256830
Author:
Amos Gilat
Publisher:
John Wiley & Sons Inc

Probability and Statistics for Engineering and th…
Statistics
ISBN:
9781305251809
Author:
Jay L. Devore
Publisher:
Cengage Learning

Statistics for The Behavioral Sciences (MindTap C…
Statistics
ISBN:
9781305504912
Author:
Frederick J Gravetter, Larry B. Wallnau
Publisher:
Cengage Learning
MATLAB: An Introduction with Applications
Statistics
ISBN:
9781119256830
Author:
Amos Gilat
Publisher:
John Wiley & Sons Inc
Probability and Statistics for Engineering and th…
Statistics
ISBN:
9781305251809
Author:
Jay L. Devore
Publisher:
Cengage Learning
Statistics for The Behavioral Sciences (MindTap C…
Statistics
ISBN:
9781305504912
Author:
Frederick J Gravetter, Larry B. Wallnau
Publisher:
Cengage Learning

Elementary Statistics: Picturing the World (7th E…
Statistics
ISBN:
9780134683416
Author:
Ron Larson, Betsy Farber
Publisher:
PEARSON

The Basic Practice of Statistics
Statistics
ISBN:
9781319042578
Author:
David S. Moore, William I. Notz, Michael A. Fligner
Publisher:
W. H. Freeman

Introduction to the Practice of Statistics
Statistics
ISBN:
9781319013387
Author:
David S. Moore, George P. McCabe, Bruce A. Craig
Publisher:
W. H. Freeman