An experiment was conducted in which two fair dice were thrown 100 times. The sum of the pips showing on the dice was then recorded. The frequency histogram to the right gives the results. Use the histogram to complete parts (a) through (f). Sum of Two Dice 20- 10- 0- 10 12 Value of dice C.... (a) What was the most frequent outcome of the experiment? (b) What was the least frequent? (c) How many times did we observe an 8? (d) How many more 5's were observed than 3's? (e) Determine the percentage of time an 8 was observed. % (f) Describe the shape of the distribution. Choose the correct answer below. Skewed right Uniform Bell-shaped Skewed left OO O O Frequency
An experiment was conducted in which two fair dice were thrown 100 times. The sum of the pips showing on the dice was then recorded. The frequency histogram to the right gives the results. Use the histogram to complete parts (a) through (f). Sum of Two Dice 20- 10- 0- 10 12 Value of dice C.... (a) What was the most frequent outcome of the experiment? (b) What was the least frequent? (c) How many times did we observe an 8? (d) How many more 5's were observed than 3's? (e) Determine the percentage of time an 8 was observed. % (f) Describe the shape of the distribution. Choose the correct answer below. Skewed right Uniform Bell-shaped Skewed left OO O O Frequency

Glencoe Algebra 1, Student Edition, 9780079039897, 0079039898, 2018
18th Edition
ISBN:9780079039897
Author:Carter
Publisher:Carter
Chapter10: Statistics
Section10.6: Summarizing Categorical Data
Problem 10CYU

Related questions
Question
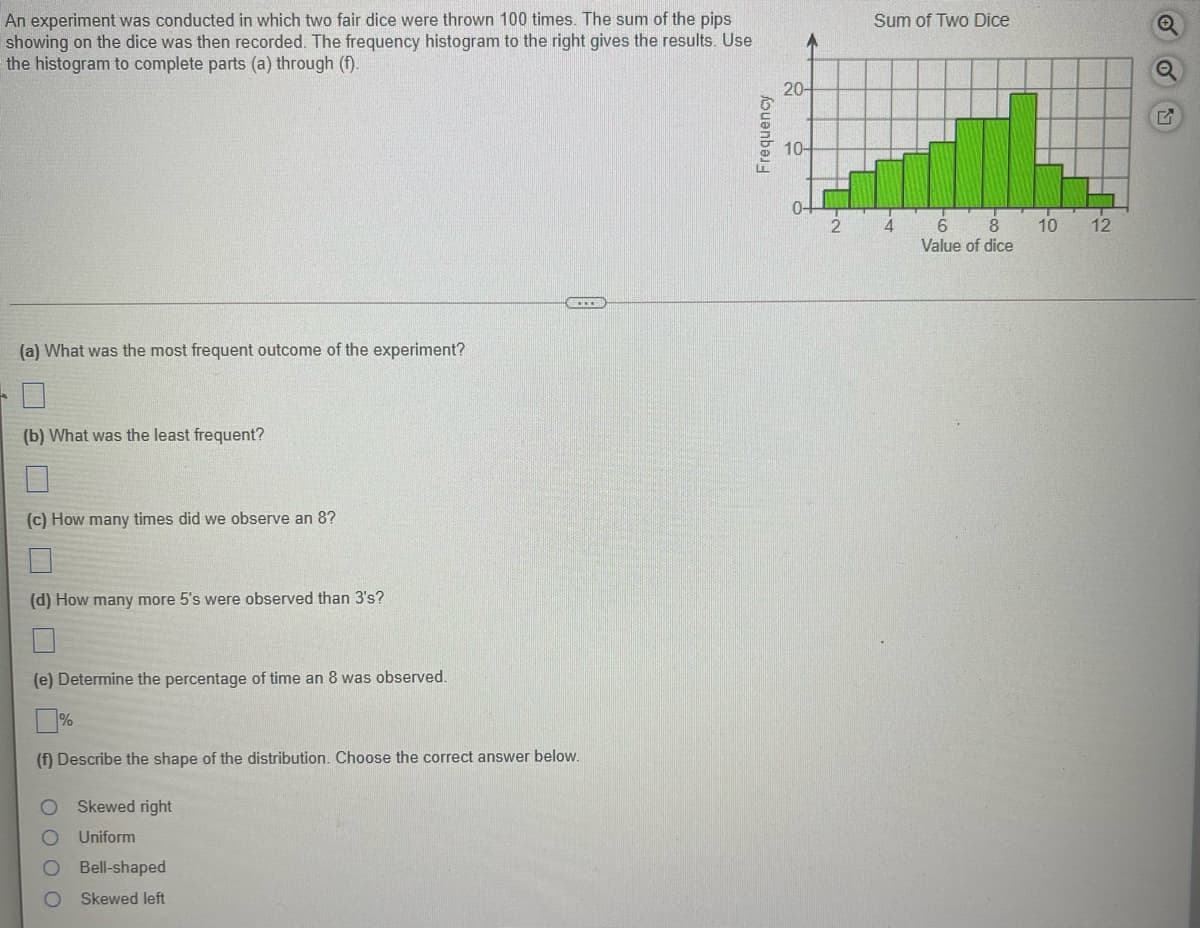
Transcribed Image Text:An experiment was conducted in which two fair dice were thrown 100 times. The sum of the pips
showing on the dice was then recorded. The frequency histogram to the right gives the results. Use
the histogram to complete parts (a) through (f).
Sum of Two Dice
20-
10-
0-
10
12
Value of dice
C....
(a) What was the most frequent outcome of the experiment?
(b) What was the least frequent?
(c) How many times did we observe an 8?
(d) How many more 5's were observed than 3's?
(e) Determine the percentage of time an 8 was observed.
%
(f) Describe the shape of the distribution. Choose the correct answer below.
Skewed right
Uniform
Bell-shaped
Skewed left
OO O O
Frequency
Expert Solution
This question has been solved!
Explore an expertly crafted, step-by-step solution for a thorough understanding of key concepts.

This is a popular solution!

Trending now
This is a popular solution!

Step by step
Solved in 2 steps

Recommended textbooks for you
Glencoe Algebra 1, Student Edition, 9780079039897…
Algebra
ISBN:
9780079039897
Author:
Carter
Publisher:
McGraw Hill

Holt Mcdougal Larson Pre-algebra: Student Edition…
Algebra
ISBN:
9780547587776
Author:
HOLT MCDOUGAL
Publisher:
HOLT MCDOUGAL
Glencoe Algebra 1, Student Edition, 9780079039897…
Algebra
ISBN:
9780079039897
Author:
Carter
Publisher:
McGraw Hill
Holt Mcdougal Larson Pre-algebra: Student Edition…
Algebra
ISBN:
9780547587776
Author:
HOLT MCDOUGAL
Publisher:
HOLT MCDOUGAL