Fish Biomass Data n y X₁ x2 X3 x4 100 14.3 15.0 12.2 48.0 388 19.1 29.4 26.0 152.2 755 54.6 58.0 24.2 469.7 1288 28.8 42.6 26.1 485.9 230 16.1 15.9 31.6 87.6 0 10.0 56.4 23.3 6.9 551 28.5 95.1 13.0 192.9 345 13.8 60.6 7.5 105.8 0 10.7 35.2 40.3 0.0 348 25.9 52.0 40.3 116.6 An experiment was conducted to study the effect of stream characteristics on fish biomass. The regressor variables are as follows: average depth (of 50 cells), x₁; area of in-stream cover (i.e., undercut banks, logs, boulders, etc.), X₂; percent canopy cover (average of 12), x3; and area > 25 centimeters in depth, x4. The response is y, the fish biomass. Use the accompanying data to complete parts (a) through (c). Click the icon to view the fish biomass data. (a) Fit a multiple linear regression including all four regression variables. ŷ= + (1)×₁ + ( ) ×+ (1)×3+ (×4 (Round the constant and x₁-coefficient to the nearest integer as needed. Round all other coefficients to two decimal places as needed.)
Fish Biomass Data n y X₁ x2 X3 x4 100 14.3 15.0 12.2 48.0 388 19.1 29.4 26.0 152.2 755 54.6 58.0 24.2 469.7 1288 28.8 42.6 26.1 485.9 230 16.1 15.9 31.6 87.6 0 10.0 56.4 23.3 6.9 551 28.5 95.1 13.0 192.9 345 13.8 60.6 7.5 105.8 0 10.7 35.2 40.3 0.0 348 25.9 52.0 40.3 116.6 An experiment was conducted to study the effect of stream characteristics on fish biomass. The regressor variables are as follows: average depth (of 50 cells), x₁; area of in-stream cover (i.e., undercut banks, logs, boulders, etc.), X₂; percent canopy cover (average of 12), x3; and area > 25 centimeters in depth, x4. The response is y, the fish biomass. Use the accompanying data to complete parts (a) through (c). Click the icon to view the fish biomass data. (a) Fit a multiple linear regression including all four regression variables. ŷ= + (1)×₁ + ( ) ×+ (1)×3+ (×4 (Round the constant and x₁-coefficient to the nearest integer as needed. Round all other coefficients to two decimal places as needed.)

Algebra & Trigonometry with Analytic Geometry
13th Edition
ISBN:9781133382119
Author:Swokowski
Publisher:Swokowski
Chapter7: Analytic Trigonometry
Section7.6: The Inverse Trigonometric Functions
Problem 91E
Question
I need help with this please, thanks
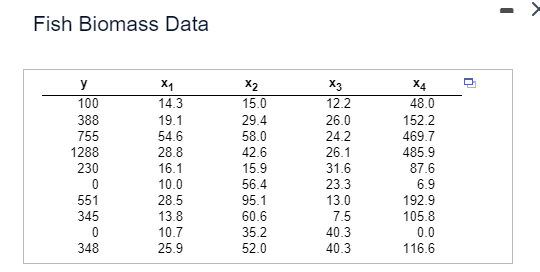
Transcribed Image Text:Fish Biomass Data
n
y
X₁
x2
X3
x4
100
14.3
15.0
12.2
48.0
388
19.1
29.4
26.0
152.2
755
54.6
58.0
24.2
469.7
1288
28.8
42.6
26.1
485.9
230
16.1
15.9
31.6
87.6
0
10.0
56.4
23.3
6.9
551
28.5
95.1
13.0
192.9
345
13.8
60.6
7.5
105.8
0
10.7
35.2
40.3
0.0
348
25.9
52.0
40.3
116.6
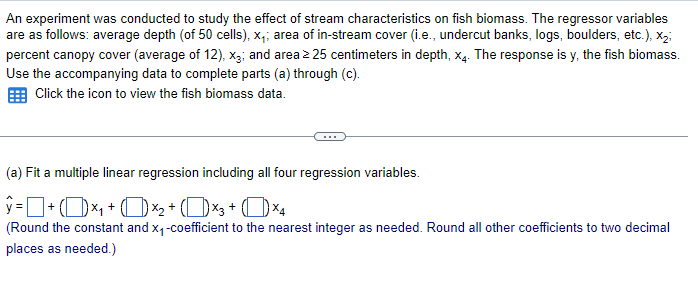
Transcribed Image Text:An experiment was conducted to study the effect of stream characteristics on fish biomass. The regressor variables
are as follows: average depth (of 50 cells), x₁; area of in-stream cover (i.e., undercut banks, logs, boulders, etc.), X₂;
percent canopy cover (average of 12), x3; and area > 25 centimeters in depth, x4. The response is y, the fish biomass.
Use the accompanying data to complete parts (a) through (c).
Click the icon to view the fish biomass data.
(a) Fit a multiple linear regression including all four regression variables.
ŷ= + (1)×₁ + ( ) ×+ (1)×3+ (×4
(Round the constant and x₁-coefficient to the nearest integer as needed. Round all other coefficients to two decimal
places as needed.)
AI-Generated Solution

Unlock instant AI solutions
Tap the button
to generate a solution
Recommended textbooks for you
Algebra & Trigonometry with Analytic Geometry
Algebra
ISBN:
9781133382119
Author:
Swokowski
Publisher:
Cengage

Algebra & Trigonometry with Analytic Geometry
Algebra
ISBN:
9781133382119
Author:
Swokowski
Publisher:
Cengage