An important advance in ecological research is the Theory of Island Blogeography, which demonstrates a relationship between the size of islands and the number of species of different amphibians that can be found in the islands, The scatterplot of number of species versus island area (in thousands of square miles) is nonlinear. The graphs below show the results of two different transformations of the data. Model I plots the square of the number of species against area. Model II plots the square root of the number of species against area. Linear regression analyses are provided below. Model II: VNumber of species vs. Area Model I: (Number of Species)? vs. Area 10 8000 9. ecies)
An important advance in ecological research is the Theory of Island Blogeography, which demonstrates a relationship between the size of islands and the number of species of different amphibians that can be found in the islands, The scatterplot of number of species versus island area (in thousands of square miles) is nonlinear. The graphs below show the results of two different transformations of the data. Model I plots the square of the number of species against area. Model II plots the square root of the number of species against area. Linear regression analyses are provided below. Model II: VNumber of species vs. Area Model I: (Number of Species)? vs. Area 10 8000 9. ecies)

College Algebra
7th Edition
ISBN:9781305115545
Author:James Stewart, Lothar Redlin, Saleem Watson
Publisher:James Stewart, Lothar Redlin, Saleem Watson
Chapter1: Equations And Graphs
Section1.3: Lines
Problem 92E

Related questions
Topic Video
Question
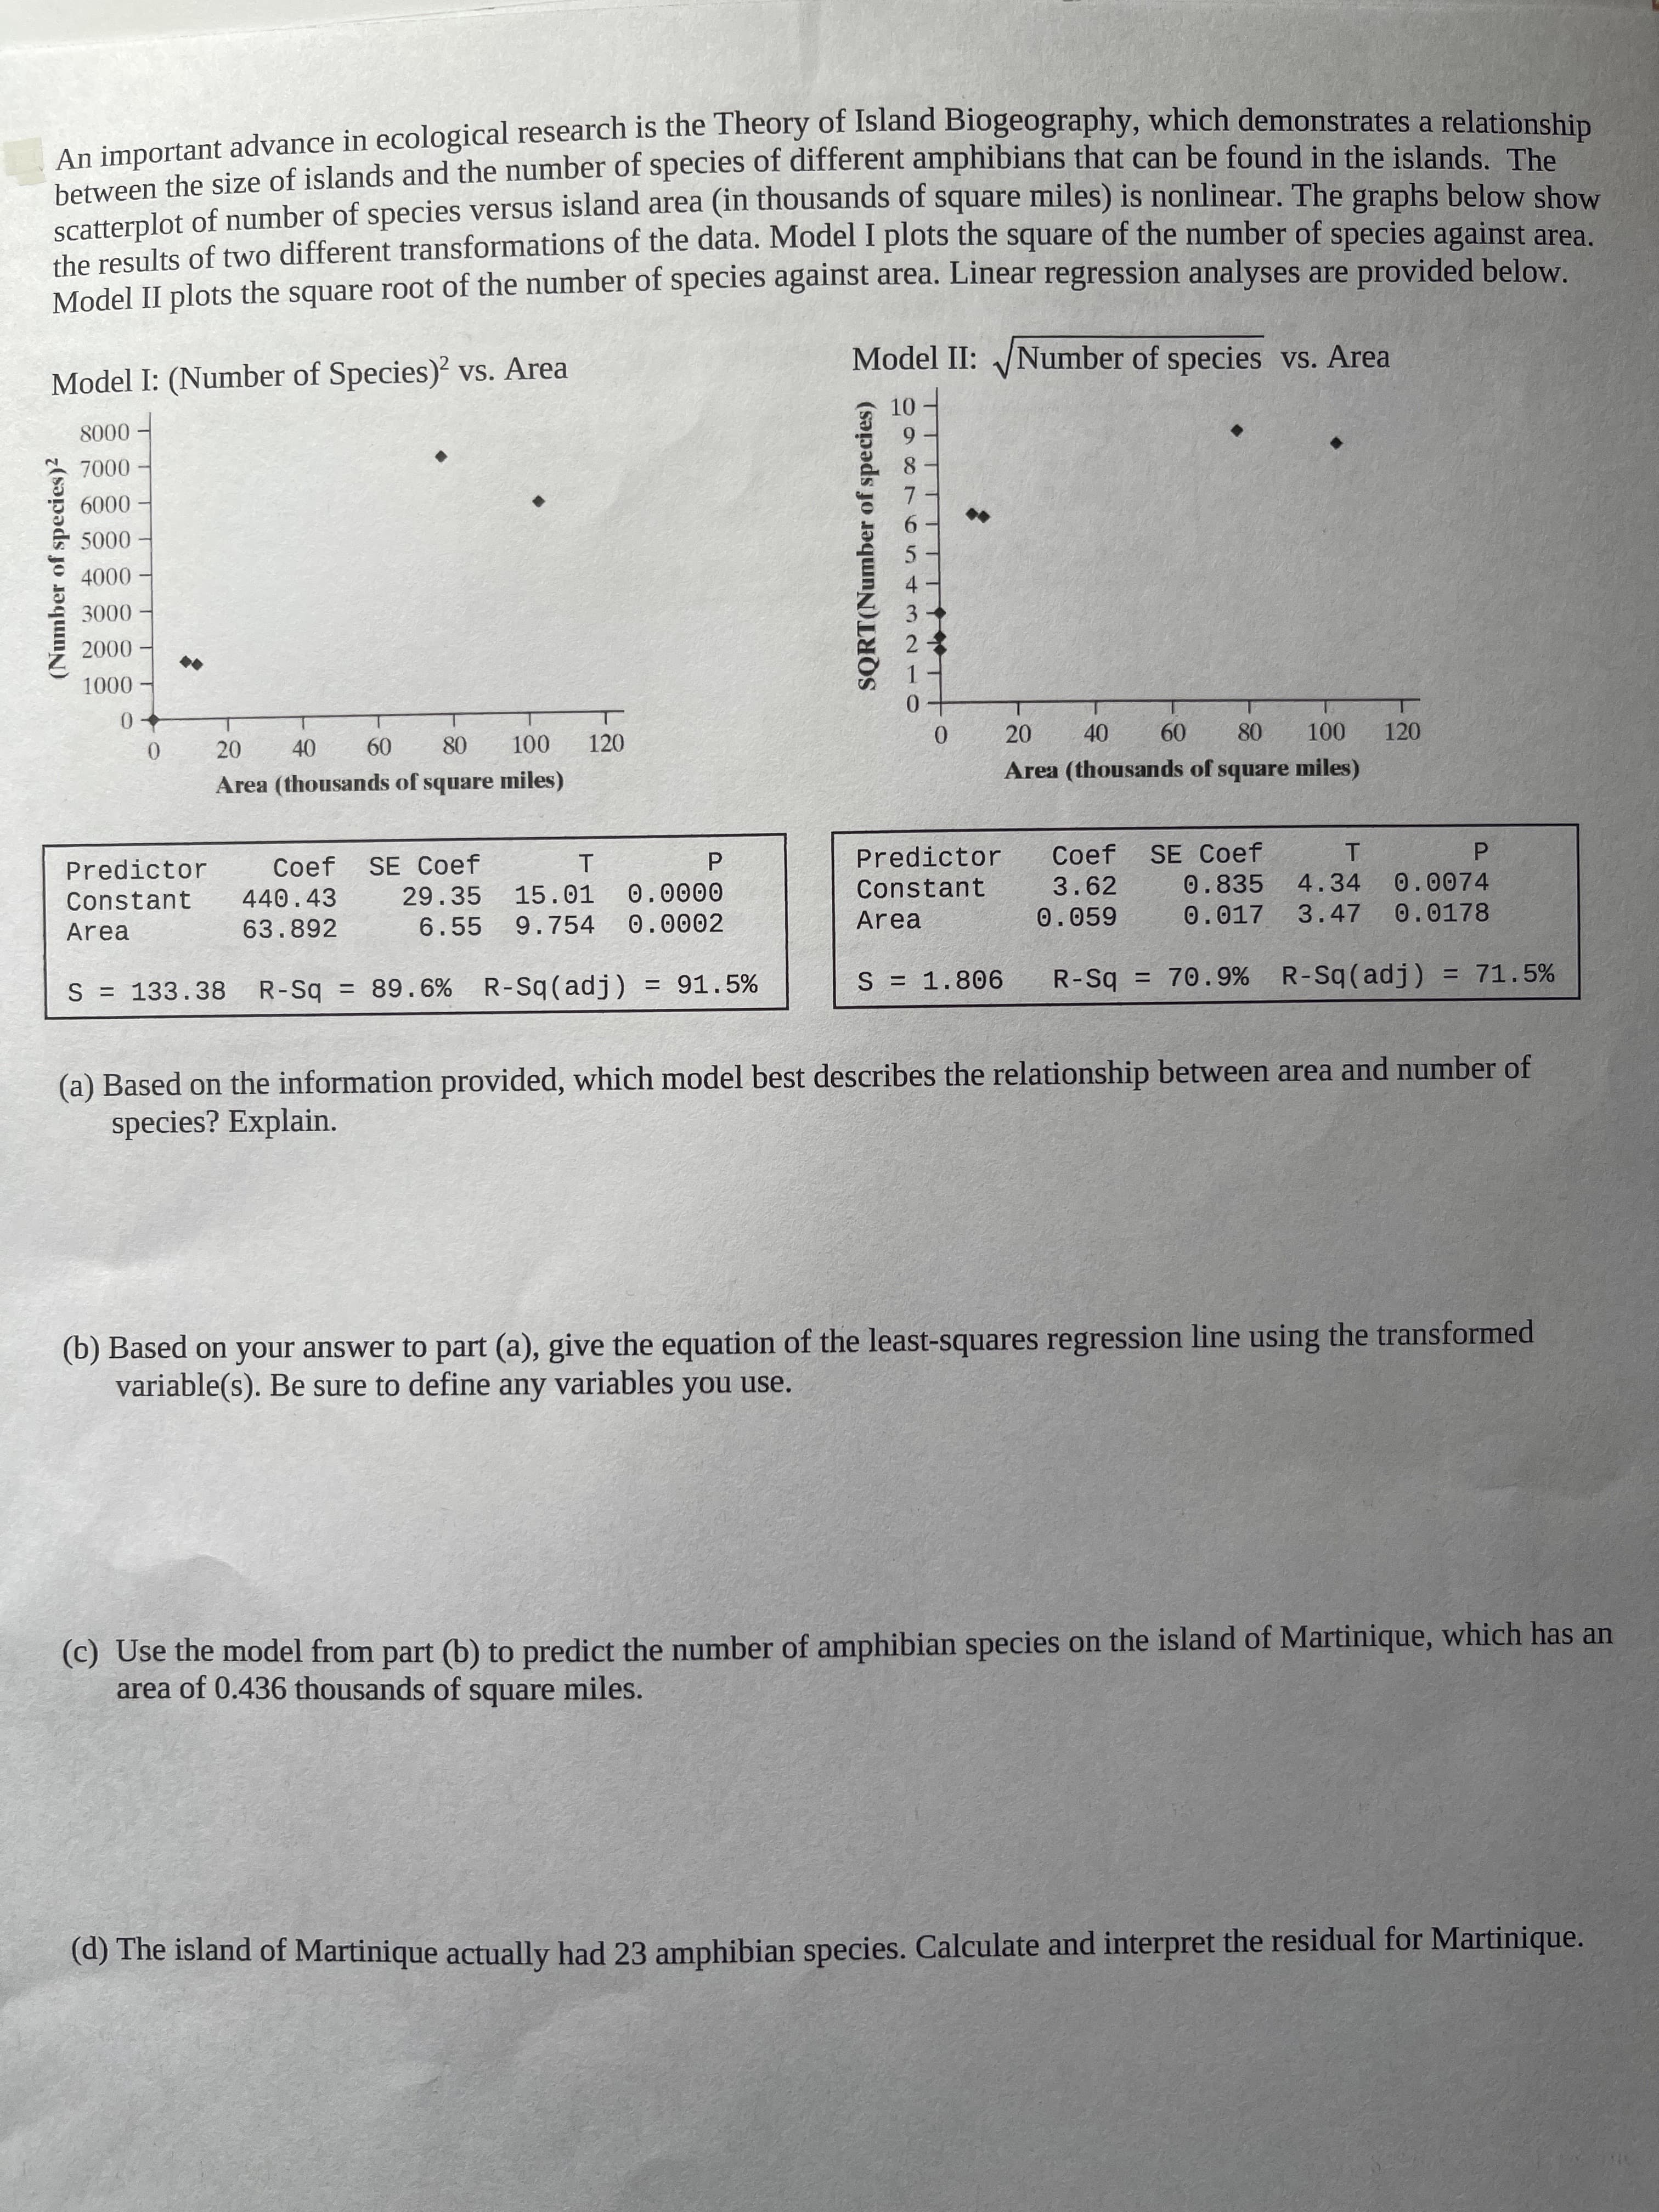
Transcribed Image Text:An important advance in ecological research is the Theory of Island Blogeography, which demonstrates a relationship
between the size of islands and the number of species of different amphibians that can be found in the islands, The
scatterplot of number of species versus island area (in thousands of square miles) is nonlinear. The graphs below show
the results of two different transformations of the data. Model I plots the square of the number of species against area.
Model II plots the square root of the number of species against area. Linear regression analyses are provided below.
Model II: VNumber of species vs. Area
Model I: (Number of Species)? vs. Area
10
8000
9.
ecies)
Expert Solution
This question has been solved!
Explore an expertly crafted, step-by-step solution for a thorough understanding of key concepts.

This is a popular solution!

Trending now
This is a popular solution!

Step by step
Solved in 2 steps

Knowledge Booster


Learn more about
Need a deep-dive on the concept behind this application? Look no further. Learn more about this topic, statistics and related others by exploring similar questions and additional content below.Recommended textbooks for you
College Algebra
Algebra
ISBN:
9781305115545
Author:
James Stewart, Lothar Redlin, Saleem Watson
Publisher:
Cengage Learning

Algebra and Trigonometry (MindTap Course List)
Algebra
ISBN:
9781305071742
Author:
James Stewart, Lothar Redlin, Saleem Watson
Publisher:
Cengage Learning

Big Ideas Math A Bridge To Success Algebra 1: Stu…
Algebra
ISBN:
9781680331141
Author:
HOUGHTON MIFFLIN HARCOURT
Publisher:
Houghton Mifflin Harcourt
College Algebra
Algebra
ISBN:
9781305115545
Author:
James Stewart, Lothar Redlin, Saleem Watson
Publisher:
Cengage Learning
Algebra and Trigonometry (MindTap Course List)
Algebra
ISBN:
9781305071742
Author:
James Stewart, Lothar Redlin, Saleem Watson
Publisher:
Cengage Learning
Big Ideas Math A Bridge To Success Algebra 1: Stu…
Algebra
ISBN:
9781680331141
Author:
HOUGHTON MIFFLIN HARCOURT
Publisher:
Houghton Mifflin Harcourt

Glencoe Algebra 1, Student Edition, 9780079039897…
Algebra
ISBN:
9780079039897
Author:
Carter
Publisher:
McGraw Hill

