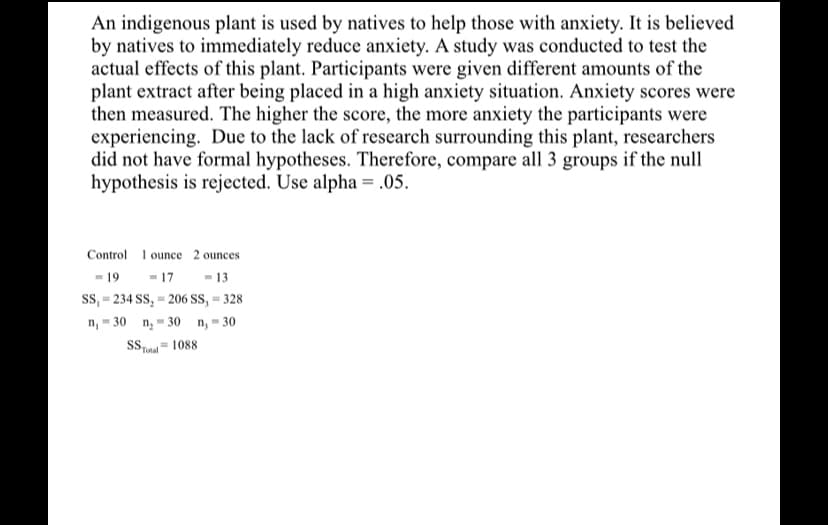
An indigenous plant is used by natives to help those with anxiety. It is believed by natives to immediately reduce anxiety. A study was conducted to test the actual effects of this plant. Participants were given different amounts of the plant extract after being placed in a high anxiety situation. Anxiety scores were then measured. The higher the score, the more anxiety the participants were experiencing. Due to the lack of research surrounding this plant, researchers did not have formal hypotheses. Therefore, compare all 3 groups if the null hypothesis is rejected. Use alpha = .05.
Q: The data represents the heights of eruptions by a geyser. Height of eruption (in.) 65 31 50 90p Use ...
A: Answer : 1. Plot A represents a stemplot of the data. Option A.
Q: Question Help ▼ An environmental agency worries that many cars may be violating clean air emissions ...
A: We have to find sample size required.
Q: In an experiment, college students were given either four quarters or a $1 bill and they could eithe...
A: a. The probability of randomly selecting a student who spent the money, given that the student given...
Q: During an initial study of a new weight loss drug, 5 people were weighed both before and 6 weeks aft...
A:
Q: A coffee enthusiast would like to test whether the coffee preference of young consumers living in Br...
A: The hypothesis being tested is: H0: µ1 = µ2 = µ3 Ha: At least one means is not equal The calculation...
Q: A population of values has a normal distribution with μ=80.9 and σ=25. You intend to draw a random s...
A:
Q: what percentile is the student with a pulse rate of 104? 68, 78, 79, 80, 85, 85, 87, 88, 90, 91, 92,...
A:
Q: How many unique random numbers need to be selected from the table of random digits? Aeronautical res...
A: Aeronautical researchers have developed three different processes to pack a parachute. They want to ...
Q: he effectiveness of a blood-pressure drug is being investigated. An experimenter finds that, on aver...
A: It is given that sample mean is 17.7 and the standard deviation is 17.9.
Q: (a). P(z<-2.2) (b). P (z 2 1.34) (c). P(-1.48<z<2.69)
A: Since you have posted a question with multiple subparts, we will solve the first three complete subp...
Q: 7. You have a coin in one hand and a six-sided die in the other hand. When you flip the coin, you w...
A: Answer Not Mutually exclusive but independent.
Q: e,f,g
A:
Q: Let x be a random variable that represents the percentage of successful free throws a professional b...
A: We have given that two random variables X and Y each of sample size 6.
Q: Question 19 What sample size is needed to give a margin of error within ±3.5% in estimating a popu...
A: From the provided information, Margin of error (E) = ±3.5% or 0.035 Confidence level = 99% Populatio...
Q: If ô, and @2 be two unbiased estimators of 0 with variances oỉ and o, respectively. What is the valu...
A: To obtain minimum variance, we will diffrentiate the variance of the unbiased estimator then equate ...
Q: Two random samples are selected from two independent populations. A summary of the samples sizes, sa...
A:
Q: The parallel histograms below display the heights of men in each of two countries. Which of the foll...
A: Given,
Q: Do you think the sample is representative of the population? Answer ‘Yes’ or ‘No’ andthen justify.
A: In statistics, a unit means an individual whose characteristics are studied. The collection of all t...
Q: A tire company wants to determine if tires made with a Is this a matched pairs design for this exper...
A: Dependent samples: Two samples are said to be dependent on each other when values of one sample is r...
Q: Find the margin of error E assuming that a simple random sample is used to estimate a population pro...
A: The margin of error is a statistic expressing the amount of random sampling error in the results of ...
Q: The weights of a certain dog breed are approximately normally distributed with a mean of 50 pounds, ...
A: The weights of a certain dog breed are approximately normally distributed with a mean of 50 pounds, ...
Q: Let z be a standard normal random variable with mean ? = 0 and standard deviation ? = 1. Use Table 3...
A: Given that Z standard normal random variable with Mean (μ) = 0 Standard deviation (σ) = 1 We know...
Q: The data below represents the number of times in one week that each of 12 students visited the schoo...
A: Given Data: 0, 0, 0, 1, 1, 2, 3, 3, 3, 3, 4, 4 Total=0+0+0+1+1+2+3+3+3+3+4+4=24
Q: Some research indicates that successful deliveries are those that do not exceed forty minutes. It is...
A: We have to find conclusion.
Q: A manager needs to know the proportion of employees who have insurance. He selects 200 employees and...
A:
Q: A population of values has a normal distribution with μ=100.1μ=100.1 and σ=56.2σ=56.2. You intend to...
A: It is given that the mean is 100.1 and the standard deviation is 56.2.
Q: A woman who smokes during pregnancy increases health risks to the infant so that it is nown that abo...
A: Note , Since you have posted a question with multiple sub-parts, we will solve first three sub-parts...
Q: Hi can you correct the wrong questions?
A: The test is right tailed.
Q: The Acme Company manufactures widgets. The distribution of widget weights is bell-shaped. The widget...
A: Empirical rule: If a population has bell-shaped distribution with mean µ and standard deviation σ ; ...
Q: correct normal distribution notation 1. X~N(93.25,13.^1) 2. X~N(93.25,14.^4) 3.X~N(93.25,3.6^2) 4. X...
A: We have to find correct answer..
Q: In the linear regression function, what does the parameter for the y-intercept (alpha) refer to? A. ...
A: Here we have to tell what does the parameter for the y-intercept (alpha) refer to?
Q: DFIND THE AREA oK THE SHADED REGION. NORMALLY DISTRIBUTED WITH MEAN 100 STANDARD DEVIATION 15 85 120
A:
Q: A local store rates employee dissatisfaction rates. An employee claimed the store routinely rates th...
A:
Q: Answer the following questions pertaining to the table attached: a) Are the variables Sex and Cancer...
A: The question consists of a data that shows the cases who are with and without cancer based on their ...
Q: For a confidence level of 99% with a sample size of 25, find the critical t value.
A: We have to find crirtical value for given data..
Q: Below are pupil sizes from two samples: 8 men and 8 women (measured in millimeters). Test the hypot...
A: Note: Hey there! Thank you for the question. As you have posted multiple questions, we have helped y...
Q: The graph illustrates a normal distribution for the prices paid for a particular model of HD televis...
A: As per guideline expert have to answer first three subpart only.
Q: Testing for a disease can be made more efficient by combining samples. If the samples from four peop...
A: We have to find correct answer.
Q: What does the number in the denominator of the t-test represent? The expected amount of sa...
A: The expected amount of sampling error (standard error) in the denominator of the t-test represent. ...
Q: A test contains two multiple choice questions, each question having fourpossible answers. If a stude...
A: The sample size n is 2.
Q: You want to see if it makes a difference which lane to be in when there is traffic. You randomly obs...
A: (1) Obtain the expected frequencies for the given table. The expected frequencies are obtained below...
Q: BASED ON UNDERSTANDING THE DIFFERENT CONCEPTS DISCUSSED UNDER CONFIDENCE INTERVALS, DETERMINE WHICH ...
A: Normal curve: It is a bell shaped curve which symmetric about mean. For this type of distribution me...
Q: The table below shows the number of state-registered automatic weapons and the murder rate for sever...
A: We want to fit a regression line (1) at X=10.8, we want to find Y (2) at X=4.4, we want to find Y
Q: A population of values has a normal distribution with u = 204.1 and o = 45.9. You intend to draw a r...
A: We have to find given probability.
Q: Hi can u answer the wrong ones
A:
Q: 2. Which of the following can not be determined by the five-number summary? Group of answer choi...
A: The five number summary includes the minimum , the first quartile (Q1) the median, the third quar...
Q: Can you answer this?
A: The paired sample t-test, sometimes called the dependent sample t-test, is a statistical procedure u...
Q: Please answer
A: Since, you have posted a question with multiple sub-parts, we will solve the first three sub-parts a...
Q: Becky and Carla take an advanced yoga class. Becky can hold 29% of her poses for over a minute, whil...
A: The answer can be given by finding the z value.
Q: uring an initial study of a new weight loss drug, 5 people were weighed both before and 6 weeks afte...
A: A)
Step by step
Solved in 4 steps with 9 images
- What is an experiment?Marshall is superstitious and suspects that people who take the GRE while wearing the same dirty socks that they wore when they got their best score on a practice test will do better than people who do not wear these “lucky” socks. In order to test that hypothesis among college students, he made 20 students wear their “lucky” socks and 20 not wear their lucky “socks” while taking the GRE test. Although he was convinced that people who wore their “lucky” socks would score higher than people who didn’t, he wanted to be able to test the possibility that they could score lower. Their scores are as follows: “Lucky” Non-“Lucky” Sock wearers Sock Wearers 108 105 107 107 112 110 113 109 105 105 100 114 120 98 *For this problem, you will be conducting a t…) Marshall is superstitious and suspects that people who take the GRE while wearing the same dirty socks that they wore when they got their best score on a practice test will do better than people who do not wear these “lucky” socks. In order to test that hypothesis among college students, he made 20 students wear their “lucky” socks and 20 not wear their lucky “socks” while taking the GRE test. Although he was convinced that people who wore their “lucky” socks would score higher than people who didn’t, he wanted to be able to test the possibility that they could score lower. Their scores are as follows: “Lucky” Non-“Lucky” Sock wearers Sock Wearers 108 105 107 107 112 110 113 109 105 105 100 114 120 98 *For this problem, you will be conducting a t…
- Marshall is superstitious and suspects that people who take the GRE while wearing the same dirty socks that they wore when they got their best score on a practice test will do better than people who do not wear these “lucky” socks. In order to test that hypothesis among college students, he made 20 students wear their “lucky” socks and 20 not wear their lucky “socks” while taking the GRE test. Although he was convinced that people who wore their “lucky” socks would score higher than people who didn’t, he wanted to be able to test the possibility that they could score lower. Their scores are as follows: “Lucky” Non-“Lucky” Sock wearers Sock Wearers 108 105 107 107 112 110 113 109 105 105 100 114 120 98 *For this problem, you will be conducting a t…Marshall is superstitious and suspects that people who take the GRE while wearing the same dirty socks that they wore when they got their best score on a practice test will do better than people who do not wear these “lucky” socks. In order to test that hypothesis among college students, he made 20 students wear their “lucky” socks and 20 not wear their lucky “socks” while taking the GRE test. Although he was convinced that people who wore their “lucky” socks would score higher than people who didn’t, he wanted to be able to test the possibility that they could score lower. Their scores are as follows: “Lucky” Non-“Lucky” Sock wearers Sock Wearers 108 105 107 107 112 110 113 109 105 105 100 114 120 98 *For this problem, you will be conducting a t…The chief of security for the Mall of the Dakotas directed a study of theft. He selected a sample of 140 boxes that had been tampered with and ascertained that, for 75 of the boxes, the missing pants, shoes, and so on were attributed to shoplifting. For 45 boxes, employees had stolen the goods, and for the remaining 20 boxes he blamed poor inventory control. In his report to the mall management, can he say that shoplifting is twice as likely to be the cause of the loss as compared with either employee theft or poor inventory control and that employee theft and poor inventory control are equally likely? Use the 0.02 significance level. H0: The proportions are as stated. H1: The proportions are not as stated. a. State the decision rule using 0.02 significance level. (Round your answer to 3 decimal places.) b. Compute the value of chi-square. (Round your answer to 3 decimal places.) c. What is your decision regarding H0?
- A young professor found out from a senior professor that psychology students in St. Alex University tend to do good in their Social Science subject, claiming that historically, the mean grade of psych students in the said course is 1.50. Curious if this claim was true, the young professor took a random sample of 9 students who took Social Science subject. Before collecting data, he was undecided about his own claim because he knew of some students who did really good in the course but has also encountered others who did poorly. He found that their mean grade for the course is 1.35 with a standard deviation of 0.50. Use the Test of Significance Approach in testing the young professor’s claim. a. Estimate μ at 90% confidence interval. b. Between z and t, which is more appropriate to use given the data? Why? c. What are the chances that your estimate of μ was wrong? Describe and explain a potential source of error to your estimate. d. Holding % of CI constant, what can you do to lower…Is there a relationship between autism and what an infant is fed? To determine if there is, a researcher asked a random sample of mothers what they had fed their infant and they also recorded whether or not the child was autistic. Almost all brands of formula sold in the U.S. are now fortified with DHA (docosahexaenoic acid) and ARA (arachidonic acid). The data are in the table below. Do the data provide enough evidence to show that that what an infant is fed and autism are dependent? Test at the 1% level and round expected values to one decimal place. what an infant is fed yes (Observed) yes (Expected Value) no (Observed) no (Expected Value) Row Total breastmilk 6 422 428 formula with DHA/ARA 7 1156 1163 formula without DHA/ARA 15 525 540 Column Total 28 2103 2131 H: HypothesesHo:Ho:Select an answer whether or not a child has autism infant infants yes and Select an answer what an infant is fed infant infants no are Select an answer independent…