(d) Based on your answers in parts (a) to (c), will you reject or fail to reject the null hypothesis? Are the data statistically significant at level a? O At the a = 0.05 level, we reject the null hypothesis and conclude the data are statistically significant. O At the a = 0.05 level, we reject the null hypothesis and conclude the data are not statistically significant. At the a = 0.05 level, we fail to reject the null hypothesis and conclude the data are statistically significant. O At the a = 0.05 level, we fail to reject the null hypothesis and conclude the data are not statistically significant. (e) Interpret your conclusion in the context of the application. Reject the null hypothesis, there is sufficient evidence that the mean percentage of young adults who attend college is higher. O Reject the null hypothesis, there is insufficient evidence that the mean percentage of young adults who attend college is higher. O Fail to reject the null hypothesis, there is insufficient evidence that the mean percentage of young adults who attend college is higher. O Fail to reject the null hypothesis, there is sufficient evidence that the mean percentage of young adults who attend college is higher.
(d) Based on your answers in parts (a) to (c), will you reject or fail to reject the null hypothesis? Are the data statistically significant at level a? O At the a = 0.05 level, we reject the null hypothesis and conclude the data are statistically significant. O At the a = 0.05 level, we reject the null hypothesis and conclude the data are not statistically significant. At the a = 0.05 level, we fail to reject the null hypothesis and conclude the data are statistically significant. O At the a = 0.05 level, we fail to reject the null hypothesis and conclude the data are not statistically significant. (e) Interpret your conclusion in the context of the application. Reject the null hypothesis, there is sufficient evidence that the mean percentage of young adults who attend college is higher. O Reject the null hypothesis, there is insufficient evidence that the mean percentage of young adults who attend college is higher. O Fail to reject the null hypothesis, there is insufficient evidence that the mean percentage of young adults who attend college is higher. O Fail to reject the null hypothesis, there is sufficient evidence that the mean percentage of young adults who attend college is higher.

MATLAB: An Introduction with Applications
6th Edition
ISBN:9781119256830
Author:Amos Gilat
Publisher:Amos Gilat
Chapter1: Starting With Matlab
Section: Chapter Questions
Problem 1P

Related questions

Topic Video
Question
Hi can you correct the wrong questions?
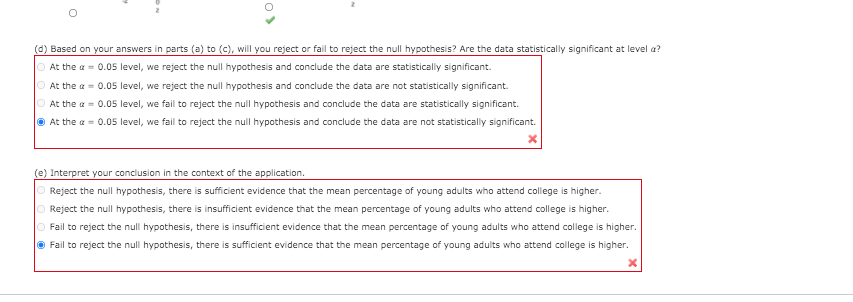
Transcribed Image Text:(d) Based on your answers in parts (a) to (c), will you reject or fail to reject the null hypothesis? Are the data statistically significant at level a?
O At the a = 0.05 level, we reject the null hypothesis and conclude the data are statistically significant.
O At the a = 0.05 level, we reject the null hypothesis and conclude the data are not statistically significant.
O At the a = 0.05 level, we fail to reject the null hypothesis and conclude the data are statistically significant.
O At the a = 0.05 level, we fail to reject the null hypothesis and conclude the data are not statistically significant.
(e) Interpret your conclusion in the context of the application.
O Reject the null hypothesis, there is sufficient evidence that the mean percentage of young adults who attend college is higher.
O Reject the null hypothesis, there is insufficient evidence that the mean percentage of young adults who attend college is higher.
O Fail to reject the null hypothesis, there is insufficient evidence that the mean percentage of young adults who attend college is higher.
O Fail to reject the null hypothesis, there is sufficient evidence that the mean percentage
young adults who attend college is higher.

Transcribed Image Text:Education influences attitude and lifestyle. Differences in education are a big factor in the "generation gap." Is the younger generation really better educated? Large surveys of people age 65 and
older were taken in n, = 37 U.S. cities. The sample mean for these cities showed that x, = 15.2% of the older adults had attended college. Large surveys of young adults (age 25 - 34) were taken
in n2 = 38 U.S. cities. The sample mean for these cities showed that x2 = 17.7% of the young adults had attended college. From previous studies, it is known that o, = 6.6% and ag = 4.6%. Does
this information indicate that the population mean percentage of young adults who attended college is higher? Use a = 0.05.
Expert Solution
This question has been solved!
Explore an expertly crafted, step-by-step solution for a thorough understanding of key concepts.

Step by step
Solved in 2 steps with 2 images

Knowledge Booster


Learn more about
Need a deep-dive on the concept behind this application? Look no further. Learn more about this topic, statistics and related others by exploring similar questions and additional content below.Recommended textbooks for you
MATLAB: An Introduction with Applications
Statistics
ISBN:
9781119256830
Author:
Amos Gilat
Publisher:
John Wiley & Sons Inc

Probability and Statistics for Engineering and th…
Statistics
ISBN:
9781305251809
Author:
Jay L. Devore
Publisher:
Cengage Learning

Statistics for The Behavioral Sciences (MindTap C…
Statistics
ISBN:
9781305504912
Author:
Frederick J Gravetter, Larry B. Wallnau
Publisher:
Cengage Learning
MATLAB: An Introduction with Applications
Statistics
ISBN:
9781119256830
Author:
Amos Gilat
Publisher:
John Wiley & Sons Inc
Probability and Statistics for Engineering and th…
Statistics
ISBN:
9781305251809
Author:
Jay L. Devore
Publisher:
Cengage Learning
Statistics for The Behavioral Sciences (MindTap C…
Statistics
ISBN:
9781305504912
Author:
Frederick J Gravetter, Larry B. Wallnau
Publisher:
Cengage Learning

Elementary Statistics: Picturing the World (7th E…
Statistics
ISBN:
9780134683416
Author:
Ron Larson, Betsy Farber
Publisher:
PEARSON

The Basic Practice of Statistics
Statistics
ISBN:
9781319042578
Author:
David S. Moore, William I. Notz, Michael A. Fligner
Publisher:
W. H. Freeman

Introduction to the Practice of Statistics
Statistics
ISBN:
9781319013387
Author:
David S. Moore, George P. McCabe, Bruce A. Craig
Publisher:
W. H. Freeman