An industrial plant claims to discharge no more than 1000 gallons of wastewater per hour, on the average, into a neighboring lake. An environmental action group decides to monitor the plant, in case this limit is being exceeded. A random sample of eight hours is selected over a period of a week. The observations (gallons of wastewater discharged per hour) are 1048 1157 1053 926 1176 1062 1026 922 The output of a statistical analysis software on this dataset is shown below Mean n 8 Reading the output, we find that • The sample size is n = 8 • The sample mean is a 1046.3 1046.3 • The sample standard deviation is s = 92.4 • From this we can calculate the standard error to be SE √n • Calculate the t-score t - 1000 SE • The degrees of freedom for the t-score is n - 1 = 11 Std. Dev. 92.4 Note that the observed sample mean is is greater than 1000 gallons per hour. This could mean that the plant is discharging more wastewater than they promised, or the plant could be in compliance, and the large numbers were due to sampling variability. To see if this is the case, we will test the hypothesis that μ = 1000 against the alternative that μ1000 at a significance level of a = 0.05. If we look up the critical value for this problem in the t-table, we would find that it is 2.365. • The magnitude of the t-score is( smaller greater) than the critical value. Therefore we should (O fail to reject reject) the hypothesis that μ = 1000 • Therefore the evidence (does does not) provide significant reason to believe that the plant is discharging more wastewater on average than they claim to be.
An industrial plant claims to discharge no more than 1000 gallons of wastewater per hour, on the average, into a neighboring lake. An environmental action group decides to monitor the plant, in case this limit is being exceeded. A random sample of eight hours is selected over a period of a week. The observations (gallons of wastewater discharged per hour) are 1048 1157 1053 926 1176 1062 1026 922 The output of a statistical analysis software on this dataset is shown below Mean n 8 Reading the output, we find that • The sample size is n = 8 • The sample mean is a 1046.3 1046.3 • The sample standard deviation is s = 92.4 • From this we can calculate the standard error to be SE √n • Calculate the t-score t - 1000 SE • The degrees of freedom for the t-score is n - 1 = 11 Std. Dev. 92.4 Note that the observed sample mean is is greater than 1000 gallons per hour. This could mean that the plant is discharging more wastewater than they promised, or the plant could be in compliance, and the large numbers were due to sampling variability. To see if this is the case, we will test the hypothesis that μ = 1000 against the alternative that μ1000 at a significance level of a = 0.05. If we look up the critical value for this problem in the t-table, we would find that it is 2.365. • The magnitude of the t-score is( smaller greater) than the critical value. Therefore we should (O fail to reject reject) the hypothesis that μ = 1000 • Therefore the evidence (does does not) provide significant reason to believe that the plant is discharging more wastewater on average than they claim to be.

Glencoe Algebra 1, Student Edition, 9780079039897, 0079039898, 2018
18th Edition
ISBN:9780079039897
Author:Carter
Publisher:Carter
Chapter10: Statistics
Section10.3: Measures Of Spread
Problem 1GP

Related questions
Question
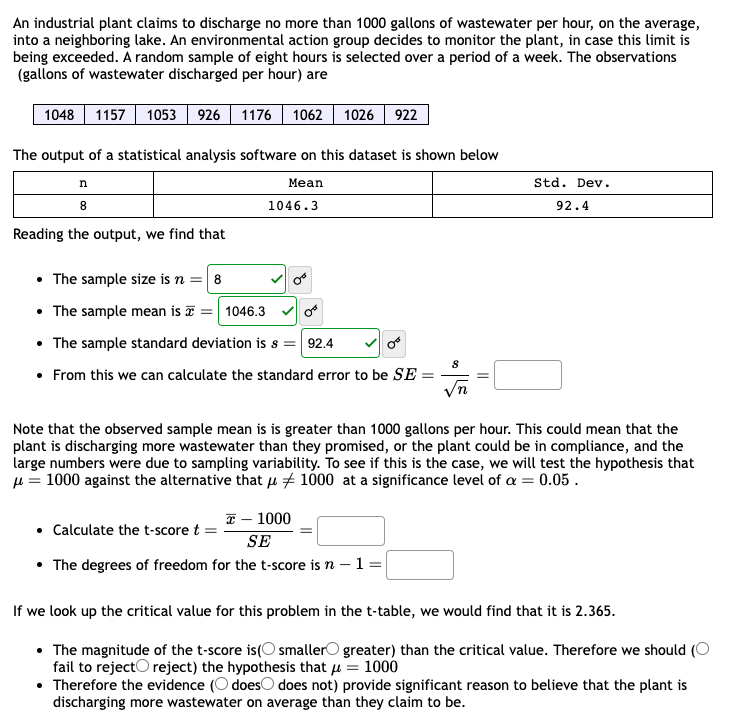
Transcribed Image Text:An industrial plant claims to discharge no more than 1000 gallons of wastewater per hour, on the average,
into a neighboring lake. An environmental action group decides to monitor the plant, in case this limit is
being exceeded. A random sample of eight hours is selected over a period of a week. The observations
(gallons of wastewater discharged per hour) are
1048 1157 1053 926 1176 1062 1026 922
The output of a statistical analysis software on this dataset is shown below
Mean
1046.3
n
8
Reading the output, we find that
• The sample size is n = 8
• The sample mean is a = 1046.3
or
• The sample standard deviation is s = 92.4
Or
• From this we can calculate the standard error to be SE
x - 1000
SE
• The degrees of freedom for the t-score is n − 1 =
8
• Calculate the t-score t =
Std. Dev.
Note that the observed sample mean is is greater than 1000 gallons per hour. This could mean that the
plant is discharging more wastewater than they promised, or the plant could be in compliance, and the
large numbers were due to sampling variability. To see if this is the case, we will test the hypothesis that
μ = 1000 against the alternative that μ1000 at a significance level of a = 0.05.
92.4
If we look up the critical value for this problem in the t-table, we would find that it is 2.365.
The magnitude of the t-score is( smaller greater) than the critical value. Therefore we should (O
fail to reject reject) the hypothesis that μ = 1000
• Therefore the evidence (does does not) provide significant reason to believe that the plant is
discharging more wastewater on average than they claim to be.
Expert Solution
This question has been solved!
Explore an expertly crafted, step-by-step solution for a thorough understanding of key concepts.

This is a popular solution!

Trending now
This is a popular solution!

Step by step
Solved in 4 steps with 1 images

Recommended textbooks for you
Glencoe Algebra 1, Student Edition, 9780079039897…
Algebra
ISBN:
9780079039897
Author:
Carter
Publisher:
McGraw Hill

Holt Mcdougal Larson Pre-algebra: Student Edition…
Algebra
ISBN:
9780547587776
Author:
HOLT MCDOUGAL
Publisher:
HOLT MCDOUGAL

College Algebra (MindTap Course List)
Algebra
ISBN:
9781305652231
Author:
R. David Gustafson, Jeff Hughes
Publisher:
Cengage Learning
Glencoe Algebra 1, Student Edition, 9780079039897…
Algebra
ISBN:
9780079039897
Author:
Carter
Publisher:
McGraw Hill
Holt Mcdougal Larson Pre-algebra: Student Edition…
Algebra
ISBN:
9780547587776
Author:
HOLT MCDOUGAL
Publisher:
HOLT MCDOUGAL
College Algebra (MindTap Course List)
Algebra
ISBN:
9781305652231
Author:
R. David Gustafson, Jeff Hughes
Publisher:
Cengage Learning