An insurance company selected samples of clients under 18 years of age and over 18 and recorded the number of accidents they had in the previous year. The results are shown below. Under Age 18 Over Age 18 n¡ = 500 n2 = 600 Number of accidents = 180 Number of accidents = 150 We are interested in determining if the accident proportions differ between the two age groups. Refer to Exhibit 10-11. The value of the test statistic is .96 O 1.96 O 2.96 3.96
An insurance company selected samples of clients under 18 years of age and over 18 and recorded the number of accidents they had in the previous year. The results are shown below. Under Age 18 Over Age 18 n¡ = 500 n2 = 600 Number of accidents = 180 Number of accidents = 150 We are interested in determining if the accident proportions differ between the two age groups. Refer to Exhibit 10-11. The value of the test statistic is .96 O 1.96 O 2.96 3.96

Glencoe Algebra 1, Student Edition, 9780079039897, 0079039898, 2018
18th Edition
ISBN:9780079039897
Author:Carter
Publisher:Carter
Chapter10: Statistics
Section10.5: Comparing Sets Of Data
Problem 14PPS

Related questions
Topic Video
Question
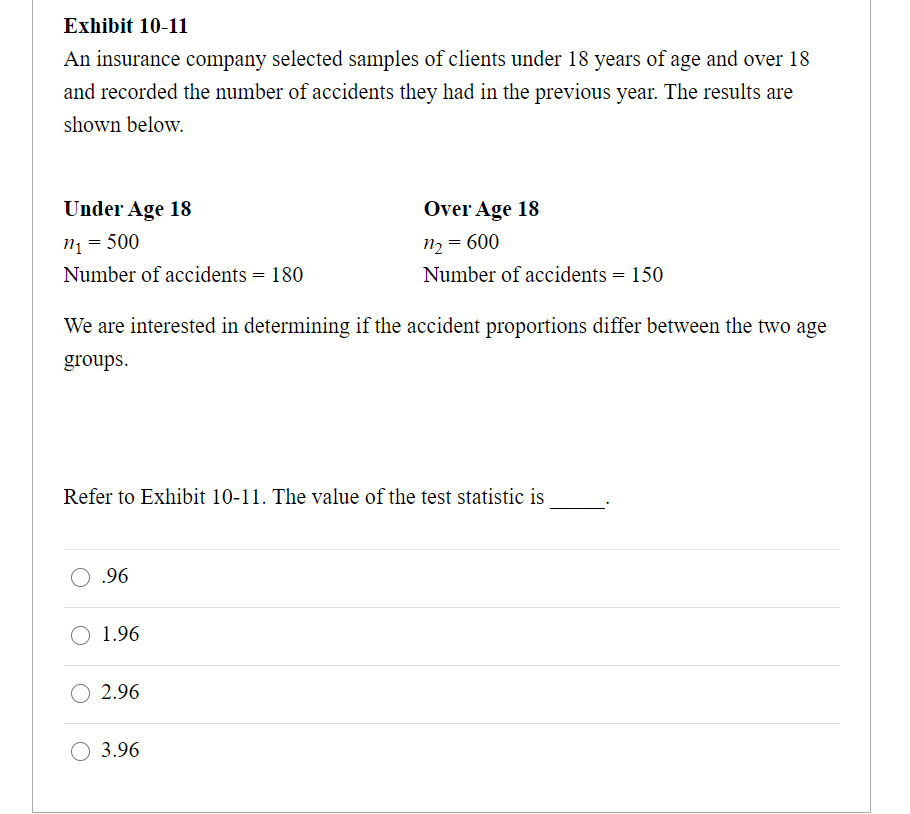
Transcribed Image Text:Exhibit 10-11
An insurance company selected samples of clients under 18 years of age and over 18
and recorded the number of accidents they had in the previous year. The results are
shown below.
Under Age 18
Over Age 18
N1 = 500
n2 = 600
Number of accidents = 180
Number of accidents = 150
We are interested in determining if the accident proportions differ between the two age
groups.
Refer to Exhibit 10-11. The value of the test statistic is
.96
1.96
2.96
О 3.96
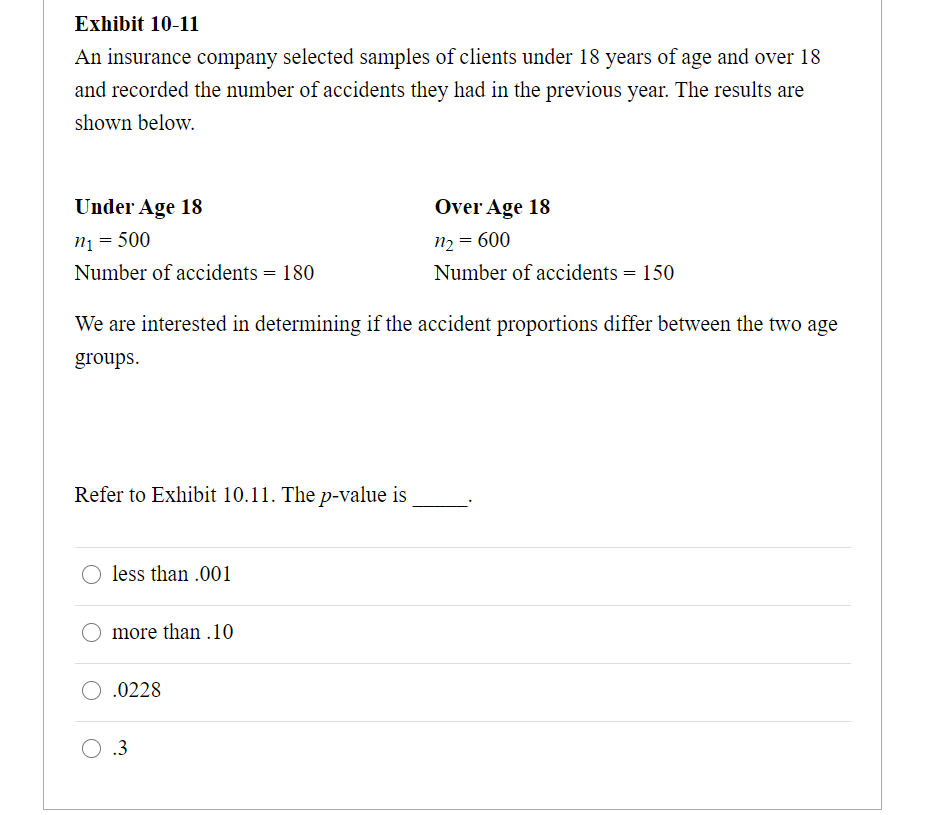
Transcribed Image Text:Exhibit 10-11
An insurance company selected samples of clients under 18 years of age and over 18
and recorded the number of accidents they had in the previous year. The results are
shown below.
Under Age 18
Over Age 18
nį = 500
n2 = 600
Number of accidents = 180
Number of accidents = 150
We are interested in determining if the accident proportions differ between the two age
groups.
Refer to Exhibit 10.11. The p-value is
O less than .001
more than .10
.0228
O .3
Expert Solution
This question has been solved!
Explore an expertly crafted, step-by-step solution for a thorough understanding of key concepts.

This is a popular solution!

Trending now
This is a popular solution!

Step by step
Solved in 2 steps with 1 images

Knowledge Booster


Learn more about
Need a deep-dive on the concept behind this application? Look no further. Learn more about this topic, statistics and related others by exploring similar questions and additional content below.Recommended textbooks for you
Glencoe Algebra 1, Student Edition, 9780079039897…
Algebra
ISBN:
9780079039897
Author:
Carter
Publisher:
McGraw Hill
Glencoe Algebra 1, Student Edition, 9780079039897…
Algebra
ISBN:
9780079039897
Author:
Carter
Publisher:
McGraw Hill